|
Download Data (XLS File) |
|
|||||
|
|||||
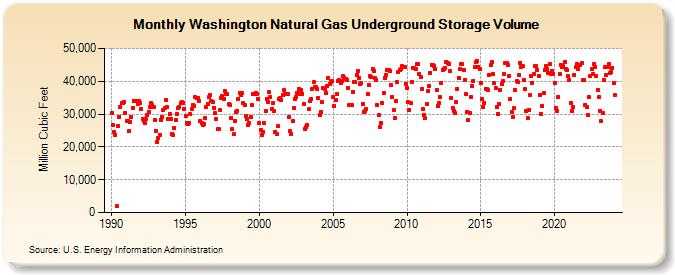
| Washington Natural Gas Underground Storage Volume (Million Cubic Feet) | |||||
| Year | Jan | Feb | Mar | Apr | May | Jun | Jul | Aug | Sep | Oct | Nov | Dec |
|---|---|---|---|---|---|---|---|---|---|---|---|---|
| 1990 | 30,182 | 26,557 | 24,604 | 23,665 | 1,893 | 26,305 | 29,242 | 32,180 | 33,249 | 33,454 | 33,535 | 30,308 |
| 1991 | 27,857 | 27,753 | 24,809 | 27,642 | 29,164 | 31,880 | 34,018 | 33,957 | 33,952 | 32,912 | 33,952 | 33,494 |
| 1992 | 31,565 | 28,585 | 28,004 | 27,127 | 28,479 | 29,654 | 30,679 | 32,137 | 33,333 | 32,774 | 32,112 | 28,315 |
| 1993 | 24,875 | 21,529 | 22,758 | 23,761 | 28,291 | 29,157 | 31,305 | 31,925 | 34,308 | 32,148 | 28,367 | 30,074 |
| 1994 | 28,472 | 23,999 | 23,565 | 25,667 | 28,271 | 30,036 | 31,845 | 32,296 | 33,429 | 33,646 | 33,258 | 31,684 |
| 1995 | 29,550 | 27,320 | 27,067 | 27,300 | 29,870 | 31,422 | 32,835 | 32,564 | 35,058 | 34,958 | 35,024 | 33,992 |
| 1996 | 27,960 | 27,171 | 26,636 | 26,980 | 28,942 | 32,260 | 33,196 | 35,162 | 35,761 | 34,119 | 33,663 | 31,924 |
| 1997 | 30,338 | 28,540 | 25,303 | 25,369 | 31,249 | 35,015 | 35,626 | 34,634 | 36,902 | 36,194 | 36,105 | 32,928 |
| 1998 | 32,856 | 28,708 | 25,379 | 23,810 | 27,742 | 30,692 | 31,004 | 34,644 | 36,466 | 35,761 | 36,521 | 33,294 |
| 1999 | 32,692 | 29,548 | 28,435 | 26,583 | 27,369 | 29,134 | 32,729 | 36,065 | 36,065 | 36,485 | 36,192 | 34,508 |
| 2000 | 27,301 | 25,253 | 23,729 | 24,622 | 27,190 | 30,850 | 34,589 | 33,799 | 36,632 | 35,260 | 31,451 | 33,414 |
| 2001 | 30,804 | 24,660 | 24,071 | 26,337 | 34,603 | 34,790 | 34,419 | 35,747 | 37,181 | 36,226 | 36,067 | 36,083 |
| 2002 | 29,031 | 24,820 | 23,943 | 27,751 | 31,783 | 34,680 | 35,287 | 36,456 | 37,709 | 36,003 | 37,325 | 36,225 |
| 2003 | 33,011 | 25,511 | 26,120 | 26,535 | 31,461 | 33,876 | 34,720 | 37,676 | 39,612 | 38,346 | 38,178 | 37,679 |
| 2004 | 34,863 | 29,743 | 30,762 | 33,795 | 37,870 | 37,627 | 36,509 | 38,489 | 40,998 | 39,233 | 39,686 | 40,037 |
| 2005 | 35,150 | 32,469 | 34,210 | 36,106 | 40,007 | 40,240 | 39,392 | 39,940 | 41,582 | 41,062 | 40,675 | 40,522 |
| 2006 | 37,948 | 32,621 | 32,888 | 32,843 | 36,829 | 39,906 | 39,622 | 41,857 | 43,237 | 40,990 | 39,269 | 39,394 |
| 2007 | 33,065 | 30,696 | 30,892 | 31,602 | 36,165 | 38,814 | 41,559 | 41,337 | 43,788 | 43,231 | 40,874 | 40,455 |
| 2008 | 32,729 | 29,572 | 26,185 | 27,426 | 33,312 | 36,369 | 41,131 | 41,812 | 43,508 | 43,570 | 42,985 | 38,790 |
| 2009 | 35,215 | 31,159 | 28,666 | 34,008 | 39,647 | 42,849 | 43,490 | 43,595 | 44,565 | 44,304 | 44,281 | 39,210 |
| 2010 | 38,061 | 33,638 | 31,321 | 33,250 | 39,900 | 44,002 | 43,912 | 43,615 | 45,311 | 45,297 | 42,064 | 41,309 |
| 2011 | 37,718 | 31,436 | 29,735 | 28,687 | 33,212 | 36,905 | 38,696 | 42,590 | 45,027 | 44,937 | 44,689 | 43,673 |
| 2012 | 37,267 | 32,496 | 33,251 | 35,110 | 39,536 | 43,521 | 43,635 | 44,126 | 45,907 | 45,537 | 45,278 | 43,019 |
| 2013 | 34,919 | 31,960 | 31,079 | 30,412 | 33,787 | 37,711 | 40,833 | 43,621 | 45,359 | 45,168 | 43,506 | 40,286 |
| 2014 | 36,064 | 30,777 | 28,105 | 30,194 | 35,225 | 38,669 | 40,198 | 44,275 | 45,800 | 46,031 | 44,476 | 43,799 |
| 2015 | 39,384 | 34,672 | 32,152 | 33,351 | 37,688 | 37,525 | 37,248 | 41,994 | 45,053 | 45,877 | 42,090 | 39,380 |
| 2016 | 37,900 | 32,046 | 30,111 | 33,029 | 37,421 | 39,255 | 40,043 | 42,133 | 45,400 | 45,508 | 45,061 | 41,596 |
| 2017 | 34,687 | 30,665 | 29,110 | 31,705 | 37,329 | 40,068 | 39,738 | 41,963 | 45,608 | 44,405 | 44,576 | 40,524 |
| 2018 | 37,628 | 30,866 | 28,661 | 31,206 | 35,768 | 41,439 | 39,585 | 42,217 | 44,699 | 44,696 | 43,303 | 41,605 |
| 2019 | 35,931 | 30,063 | 32,398 | 36,496 | 43,298 | 44,598 | 43,622 | 42,454 | 45,280 | 42,211 | 43,023 | 42,261 |
| 2020 | 39,591 | 31,866 | 30,816 | 35,275 | 42,242 | 44,954 | 44,261 | 44,560 | 45,834 | 43,814 | 43,492 | 41,548 |
| 2021 | 40,262 | 33,471 | 31,040 | 32,135 | 42,047 | 44,246 | 45,226 | 43,692 | 44,949 | 45,070 | 45,402 | 40,247 |
| 2022 | 40,223 | 32,844 | 32,189 | 29,729 | 35,086 | 41,481 | 43,683 | 42,120 | 45,288 | 44,300 | 41,596 | 37,371 |
| 2023 | 35,105 | 31,010 | 27,762 | 30,439 | 40,388 | 44,328 | 41,998 | 44,406 | 45,173 | 42,504 | 42,816 | 44,046 |
| 2024 | 39,602 | |||||||||||
| - = No Data Reported; -- = Not Applicable; NA = Not Available; W = Withheld to avoid disclosure of individual company data. |
| Release Date: 3/29/2024 |
| Next Release Date: 4/30/2024 |