|
Download Data (XLS File) |
|
|||||
|
|||||
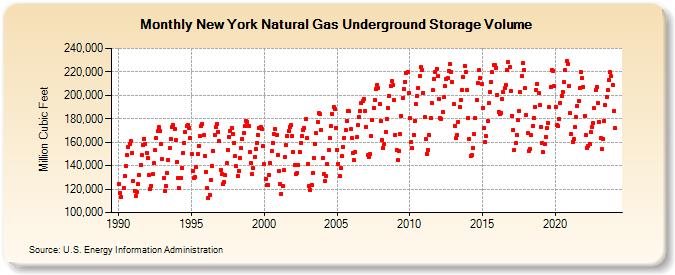
| New York Natural Gas Underground Storage Volume (Million Cubic Feet) | |||||
| Year | Jan | Feb | Mar | Apr | May | Jun | Jul | Aug | Sep | Oct | Nov | Dec |
|---|---|---|---|---|---|---|---|---|---|---|---|---|
| 1990 | 124,150 | 116,994 | 113,349 | 121,215 | 131,103 | 139,757 | 148,861 | 155,592 | 158,419 | 160,981 | 150,947 | |
| 1991 | 127,051 | 118,721 | 114,190 | 117,571 | 124,275 | 132,029 | 140,317 | 149,058 | 157,799 | 163,054 | 158,736 | 151,036 |
| 1992 | 146,171 | 131,831 | 119,880 | 122,969 | 132,698 | 142,107 | 153,543 | 163,508 | 169,298 | 172,708 | 169,361 | 158,828 |
| 1993 | 145,521 | 129,184 | 118,756 | 122,771 | 133,838 | 144,835 | 154,895 | 162,969 | 172,642 | 174,589 | 171,253 | 161,801 |
| 1994 | 143,310 | 129,129 | 120,675 | 129,563 | 138,273 | 150,582 | 159,688 | 168,628 | 173,584 | 174,977 | 172,352 | 163,470 |
| 1995 | 149,768 | 135,478 | 129,570 | 130,077 | 138,659 | 150,010 | 156,744 | 165,026 | 173,947 | 175,635 | 165,945 | 148,196 |
| 1996 | 134,676 | 121,244 | 112,642 | 115,174 | 127,887 | 139,919 | 152,757 | 165,720 | 172,678 | 175,434 | 169,096 | 160,743 |
| 1997 | 136,718 | 133,082 | 124,154 | 125,954 | 131,797 | 142,249 | 153,582 | 164,611 | 169,761 | 172,104 | 167,316 | 159,534 |
| 1998 | 148,212 | 139,451 | 131,592 | 135,814 | 146,753 | 154,758 | 162,417 | 168,005 | 173,648 | 178,080 | 177,231 | 174,110 |
| 1999 | 151,479 | 142,185 | 133,033 | 137,655 | 147,238 | 153,917 | 159,656 | 166,385 | 172,067 | 173,076 | 171,576 | 156,599 |
| 2000 | 141,080 | 128,562 | 123,199 | 123,468 | 132,188 | 142,146 | 152,098 | 159,547 | 167,217 | 171,253 | 166,188 | 148,915 |
| 2001 | 135,804 | 123,987 | 116,226 | 122,626 | 135,919 | 147,128 | 157,358 | 165,211 | 169,921 | 173,292 | 174,584 | 165,663 |
| 2002 | 151,243 | 140,262 | 132,713 | 133,988 | 140,872 | 151,825 | 159,535 | 165,039 | 170,553 | 172,191 | 179,425 | 163,835 |
| 2003 | 141,599 | 122,265 | 119,159 | 123,878 | 133,560 | 146,338 | 158,060 | 167,586 | 177,319 | 184,875 | 183,653 | 170,355 |
| 2004 | 146,657 | 132,478 | 126,726 | 131,024 | 141,351 | 153,361 | 163,957 | 173,625 | 183,933 | 190,407 | 188,400 | 172,468 |
| 2005 | 153,730 | 141,628 | 131,312 | 138,125 | 148,028 | 156,228 | 163,811 | 170,249 | 178,111 | 186,556 | 186,388 | 170,946 |
| 2006 | 163,285 | 150,867 | 144,557 | 152,034 | 164,323 | 174,665 | 181,871 | 186,191 | 193,252 | 195,193 | 196,514 | 186,941 |
| 2007 | 173,072 | 148,842 | 147,670 | 150,135 | 165,612 | 178,998 | 189,536 | 195,909 | 205,177 | 209,108 | 206,040 | 192,646 |
| 2008 | 178,193 | 162,120 | 154,939 | 158,048 | 168,756 | 179,511 | 189,044 | 199,637 | 207,842 | 212,271 | 208,539 | 195,810 |
| 2009 | 166,394 | 153,365 | 144,780 | 152,693 | 166,766 | 182,682 | 197,354 | 205,113 | 211,702 | 219,342 | 219,979 | 201,902 |
| 2010 | 180,263 | 160,508 | 155,042 | 166,252 | 178,495 | 192,486 | 199,127 | 206,502 | 216,679 | 223,782 | 221,411 | 202,247 |
| 2011 | 181,271 | 162,590 | 150,355 | 153,545 | 165,998 | 180,794 | 193,386 | 204,215 | 213,751 | 219,521 | 222,835 | 216,054 |
| 2012 | 196,903 | 180,483 | 179,949 | 185,931 | 198,162 | 207,501 | 213,518 | 214,338 | 221,094 | 226,855 | 220,189 | 211,518 |
| 2013 | 192,465 | 174,104 | 163,250 | 166,528 | 177,048 | 190,166 | 195,803 | 204,838 | 215,729 | 225,322 | 219,814 | 204,329 |
| 2014 | 180,304 | 162,974 | 148,145 | 149,423 | 155,423 | 166,822 | 180,602 | 196,271 | 210,400 | 221,669 | 214,631 | 209,402 |
| 2015 | 189,286 | 172,096 | 160,306 | 165,069 | 177,921 | 193,218 | 202,772 | 211,061 | 219,558 | 225,566 | 225,551 | 223,532 |
| 2016 | 200,512 | 186,130 | 183,647 | 185,206 | 196,464 | 202,671 | 206,138 | 209,161 | 221,382 | 228,198 | 223,763 | 203,547 |
| 2017 | 182,709 | 170,275 | 153,258 | 159,076 | 166,345 | 178,532 | 186,848 | 202,637 | 216,370 | 227,215 | 221,470 | 205,976 |
| 2018 | 183,174 | 167,737 | 152,907 | 153,854 | 166,030 | 174,010 | 180,916 | 190,376 | 204,909 | 209,830 | 202,215 | 191,761 |
| 2019 | 173,382 | 159,107 | 151,403 | 158,656 | 164,539 | 172,387 | 176,004 | 189,598 | 207,001 | 221,214 | 221,113 | 207,737 |
| 2020 | 190,215 | 174,890 | 173,645 | 179,712 | 193,265 | 199,693 | 203,132 | 211,308 | 221,229 | 229,238 | 226,340 | 207,946 |
| 2021 | 184,778 | 167,187 | 160,487 | 162,675 | 173,183 | 181,199 | 190,770 | 194,961 | 206,090 | 219,518 | 214,699 | 207,353 |
| 2022 | 182,155 | 166,189 | 155,186 | 157,114 | 158,353 | 168,755 | 172,540 | 176,422 | 188,876 | 204,122 | 207,137 | 193,481 |
| 2023 | 177,540 | 163,184 | 153,823 | 163,127 | 178,425 | 191,587 | 198,324 | 204,435 | 213,013 | 219,608 | 216,101 | 208,961 |
| 2024 | 186,633 | 172,035 | 163,578 | 168,302 | 180,628 | 190,355 | ||||||
| - = No Data Reported; -- = Not Applicable; NA = Not Available; W = Withheld to avoid disclosure of individual company data. |
| Release Date: 8/30/2024 |
| Next Release Date: 9/30/2024 |