|
Download Data (XLS File) |
|
|||||
|
|||||
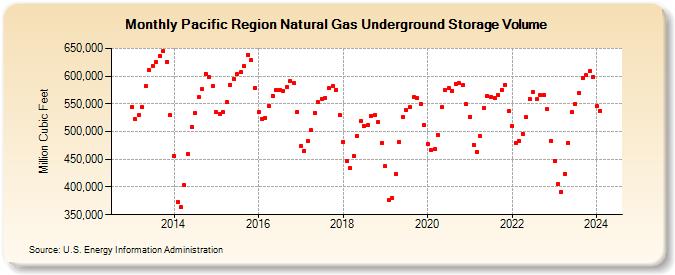
| Pacific Region Natural Gas Underground Storage Volume (Million Cubic Feet) | |||||
| Year | Jan | Feb | Mar | Apr | May | Jun | Jul | Aug | Sep | Oct | Nov | Dec |
|---|---|---|---|---|---|---|---|---|---|---|---|---|
| 2013 | 544,417 | 522,182 | 529,030 | 543,901 | 581,848 | 610,748 | 619,005 | 624,692 | 636,405 | 645,077 | 626,113 | 529,510 |
| 2014 | 456,688 | 373,776 | 363,397 | 402,887 | 459,189 | 507,932 | 533,461 | 561,487 | 576,755 | 604,676 | 598,236 | 581,556 |
| 2015 | 535,012 | 532,186 | 534,713 | 552,592 | 584,491 | 595,030 | 603,251 | 606,862 | 617,976 | 638,832 | 628,206 | 579,071 |
| 2016 | 535,527 | 521,897 | 525,124 | 546,324 | 565,012 | 575,121 | 575,495 | 573,856 | 580,769 | 590,550 | 587,760 | 535,527 |
| 2017 | 473,898 | 464,968 | 483,037 | 502,106 | 534,331 | 552,468 | 559,507 | 561,287 | 577,989 | 581,842 | 575,590 | 529,976 |
| 2018 | 481,900 | 446,830 | 434,417 | 455,561 | 491,836 | 518,790 | 509,732 | 511,611 | 528,547 | 529,628 | 517,574 | 479,718 |
| 2019 | 437,106 | 376,447 | 380,202 | 424,128 | 481,699 | 526,040 | 538,975 | 543,644 | 561,440 | 559,665 | 549,906 | 512,239 |
| 2020 | 477,225 | 466,392 | 467,773 | 494,428 | 543,645 | 574,963 | 578,177 | 573,961 | 585,781 | 587,110 | 583,264 | 549,568 |
| 2021 | 526,765 | 476,498 | 463,824 | 491,345 | 541,581 | 564,077 | 562,324 | 560,492 | 566,017 | 575,687 | 584,786 | 536,414 |
| 2022 | 510,014 | 479,250 | 482,821 | 495,817 | 525,703 | 557,963 | 571,345 | 558,572 | 565,849 | 566,142 | 539,967 | 483,748 |
| 2023 | 447,456 | 405,896 | 391,306 | 423,925 | 480,211 | 534,470 | 550,226 | 570,217 | 597,176 | 601,281 | 608,528 | 599,255 |
| 2024 | 545,632 | 537,615 | 548,913 | 564,680 | 592,468 | 604,764 | ||||||
| - = No Data Reported; -- = Not Applicable; NA = Not Available; W = Withheld to avoid disclosure of individual company data. |
| Release Date: 8/30/2024 |
| Next Release Date: 9/30/2024 |