|
Download Data (XLS File) |
|
|||||
|
|||||
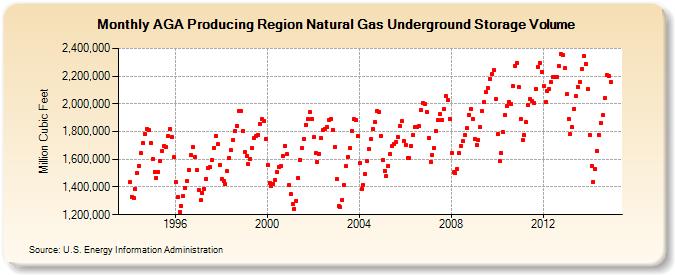
| AGA Producing Region Natural Gas Underground Storage Volume (Million Cubic Feet) | |||||
| Year | Jan | Feb | Mar | Apr | May | Jun | Jul | Aug | Sep | Oct | Nov | Dec |
|---|---|---|---|---|---|---|---|---|---|---|---|---|
| 1994 | 1,433,462 | 1,329,400 | 1,322,914 | 1,388,877 | 1,498,496 | 1,553,493 | 1,643,445 | 1,714,361 | 1,785,350 | 1,819,344 | 1,810,791 | 1,716,773 |
| 1995 | 1,601,428 | 1,510,175 | 1,467,414 | 1,509,666 | 1,586,445 | 1,662,195 | 1,696,619 | 1,688,515 | 1,768,189 | 1,818,098 | 1,757,160 | 1,613,046 |
| 1996 | 1,436,765 | 1,325,994 | 1,223,139 | 1,264,513 | 1,334,894 | 1,395,779 | 1,443,970 | 1,525,797 | 1,631,006 | 1,686,652 | 1,614,154 | 1,519,539 |
| 1997 | 1,379,108 | 1,303,888 | 1,356,678 | 1,385,616 | 1,461,221 | 1,536,339 | 1,542,480 | 1,596,011 | 1,683,987 | 1,770,002 | 1,707,810 | 1,559,636 |
| 1998 | 1,456,136 | 1,442,993 | 1,420,644 | 1,515,050 | 1,610,474 | 1,666,304 | 1,739,745 | 1,803,097 | 1,840,984 | 1,950,772 | 1,945,897 | 1,807,163 |
| 1999 | 1,650,888 | 1,623,045 | 1,567,297 | 1,604,018 | 1,680,411 | 1,753,089 | 1,769,491 | 1,776,688 | 1,854,886 | 1,887,259 | 1,877,283 | 1,749,675 |
| 2000 | 1,559,171 | 1,432,141 | 1,403,999 | 1,423,729 | 1,451,007 | 1,508,604 | 1,547,370 | 1,552,320 | 1,623,015 | 1,697,818 | 1,635,386 | 1,412,654 |
| 2001 | 1,347,770 | 1,275,137 | 1,241,606 | 1,301,406 | 1,466,759 | 1,597,639 | 1,682,437 | 1,745,889 | 1,849,997 | 1,887,536 | 1,942,268 | 1,890,882 |
| 2002 | 1,760,643 | 1,642,854 | 1,581,691 | 1,641,258 | 1,751,131 | 1,812,061 | 1,819,440 | 1,835,400 | 1,886,660 | 1,893,565 | 1,814,355 | 1,685,142 |
| 2003 | 1,456,703 | 1,264,851 | 1,253,910 | 1,308,378 | 1,415,803 | 1,548,220 | 1,619,932 | 1,680,349 | 1,805,652 | 1,888,250 | 1,880,576 | 1,767,279 |
| 2004 | 1,570,329 | 1,382,869 | 1,414,173 | 1,490,857 | 1,586,153 | 1,673,679 | 1,747,346 | 1,814,863 | 1,867,354 | 1,949,941 | 1,943,174 | 1,768,684 |
| 2005 | 1,593,995 | 1,518,674 | 1,477,937 | 1,553,441 | 1,638,293 | 1,694,025 | 1,713,394 | 1,722,600 | 1,762,460 | 1,840,901 | 1,872,863 | 1,733,558 |
| 2006 | 1,706,342 | 1,608,426 | 1,609,278 | 1,696,529 | 1,776,358 | 1,836,085 | 1,835,002 | 1,838,379 | 1,956,173 | 2,007,654 | 2,001,779 | 1,937,971 |
| 2007 | 1,755,863 | 1,581,346 | 1,633,404 | 1,683,694 | 1,803,445 | 1,884,297 | 1,926,040 | 1,885,190 | 1,962,460 | 2,054,959 | 2,026,887 | 1,891,462 |
| 2008 | 1,644,699 | 1,507,058 | 1,499,067 | 1,532,906 | 1,643,365 | 1,697,636 | 1,730,960 | 1,775,601 | 1,829,222 | 1,922,233 | 1,960,693 | 1,890,947 |
| 2009 | 1,745,655 | 1,701,989 | 1,737,694 | 1,829,730 | 1,949,517 | 2,014,993 | 2,082,785 | 2,112,674 | 2,182,610 | 2,212,962 | 2,245,356 | 2,034,136 |
| 2010 | 1,780,106 | 1,585,079 | 1,646,201 | 1,794,656 | 1,917,185 | 1,985,890 | 2,010,522 | 2,000,657 | 2,128,284 | 2,274,109 | 2,295,067 | 2,118,276 |
| 2011 | 1,894,007 | 1,737,794 | 1,776,201 | 1,867,737 | 1,992,080 | 2,031,882 | 2,020,833 | 2,005,252 | 2,108,959 | 2,266,071 | 2,297,470 | 2,232,985 |
| 2012 | 2,129,406 | 2,011,907 | 2,092,538 | 2,108,190 | 2,156,671 | 2,191,779 | 2,190,501 | 2,191,378 | 2,272,058 | 2,359,988 | 2,352,969 | 2,261,511 |
| 2013 | 2,068,977 | 1,894,155 | 1,780,505 | 1,829,371 | 1,964,220 | 2,053,893 | 2,124,421 | 2,159,156 | 2,252,603 | 2,344,616 | 2,289,373 | 2,106,167 |
| 2014 | 1,776,724 | 1,554,225 | 1,436,549 | 1,526,546 | 1,662,027 | 1,773,531 | 1,863,519 | 1,917,665 | 2,042,184 | 2,206,064 | 2,200,189 | 2,159,737 |
| - = No Data Reported; -- = Not Applicable; NA = Not Available; W = Withheld to avoid disclosure of individual company data. |
| Release Date: 4/30/2024 |
| Next Release Date: 5/31/2024 |