|
Download Data (XLS File) |
|
|||||
|
|||||
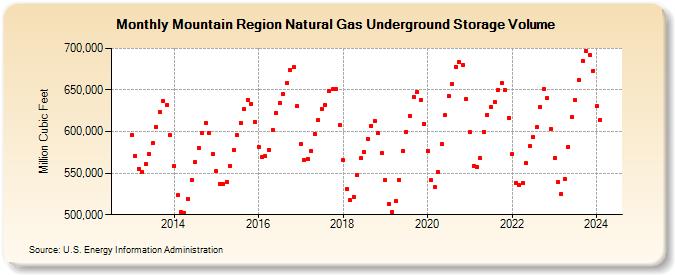
| Mountain Region Natural Gas Underground Storage Volume (Million Cubic Feet) | |||||
| Year | Jan | Feb | Mar | Apr | May | Jun | Jul | Aug | Sep | Oct | Nov | Dec |
|---|---|---|---|---|---|---|---|---|---|---|---|---|
| 2013 | 596,220 | 571,001 | 555,330 | 550,911 | 560,785 | 573,145 | 586,231 | 605,322 | 623,662 | 636,750 | 632,304 | 595,336 |
| 2014 | 558,453 | 523,122 | 503,750 | 502,309 | 519,323 | 541,977 | 562,863 | 580,527 | 598,135 | 610,882 | 598,284 | 573,155 |
| 2015 | 552,277 | 537,185 | 537,004 | 539,816 | 558,882 | 578,300 | 595,505 | 610,816 | 626,924 | 638,383 | 633,170 | 611,934 |
| 2016 | 581,770 | 569,203 | 570,106 | 577,842 | 602,384 | 622,178 | 634,145 | 644,943 | 658,353 | 674,427 | 677,536 | 630,344 |
| 2017 | 585,040 | 566,345 | 567,299 | 576,692 | 596,691 | 613,904 | 627,425 | 631,693 | 648,485 | 650,754 | 650,803 | 607,298 |
| 2018 | 565,411 | 531,104 | 517,200 | 521,410 | 547,618 | 567,694 | 575,728 | 591,113 | 606,993 | 612,972 | 597,861 | 573,702 |
| 2019 | 541,604 | 512,915 | 503,606 | 516,700 | 542,208 | 576,328 | 599,974 | 619,112 | 641,677 | 647,402 | 638,436 | 609,518 |
| 2020 | 577,104 | 541,409 | 533,555 | 551,106 | 585,316 | 619,588 | 643,045 | 657,617 | 677,930 | 683,456 | 680,392 | 639,160 |
| 2021 | 598,890 | 559,127 | 557,296 | 567,640 | 600,029 | 620,353 | 629,839 | 635,703 | 650,516 | 658,613 | 649,700 | 616,579 |
| 2022 | 573,156 | 538,506 | 535,268 | 538,122 | 561,932 | 582,597 | 593,030 | 605,039 | 629,850 | 651,596 | 639,885 | 603,083 |
| 2023 | 568,320 | 539,208 | 524,765 | 543,481 | 581,793 | 617,035 | 637,713 | 662,007 | 685,035 | 697,403 | 692,074 | 673,118 |
| 2024 | 630,556 | 614,281 | ||||||||||
| - = No Data Reported; -- = Not Applicable; NA = Not Available; W = Withheld to avoid disclosure of individual company data. |
| Release Date: 4/30/2024 |
| Next Release Date: 5/31/2024 |