|
Download Data (XLS File) |
|
|||||
|
|||||
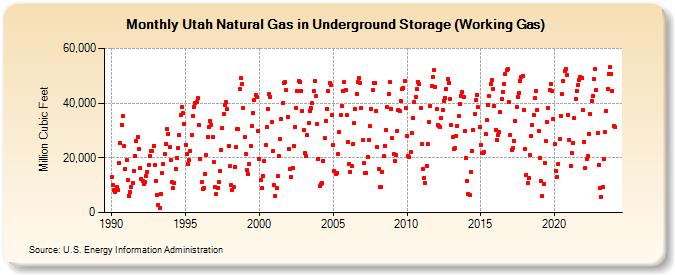
| Utah Natural Gas in Underground Storage (Working Gas) (Million Cubic Feet) | |||||
| Year | Jan | Feb | Mar | Apr | May | Jun | Jul | Aug | Sep | Oct | Nov | Dec |
|---|---|---|---|---|---|---|---|---|---|---|---|---|
| 1990 | 12,862 | 9,993 | 8,285 | 7,662 | 9,184 | 8,305 | 17,964 | 25,464 | 32,121 | 35,381 | 24,204 | 15,997 |
| 1991 | 19,120 | 11,915 | 6,118 | 7,419 | 9,193 | 10,977 | 15,226 | 20,591 | 26,089 | 27,689 | 23,281 | 16,335 |
| 1992 | 12,422 | 11,379 | 10,289 | 10,996 | 13,431 | 14,981 | 17,321 | 20,674 | 22,548 | 22,548 | 24,443 | 17,445 |
| 1993 | 11,572 | 6,509 | 2,846 | 1,790 | 6,910 | 14,321 | 17,591 | 21,416 | 25,209 | 30,558 | 28,654 | 23,933 |
| 1994 | 19,228 | 11,023 | 8,848 | 10,700 | 16,020 | 20,043 | 23,603 | 28,351 | 35,530 | 38,408 | 36,205 | 32,543 |
| 1995 | 24,686 | 21,295 | 17,719 | 19,062 | 22,565 | 28,207 | 35,155 | 38,580 | 40,143 | 40,419 | 41,689 | 31,835 |
| 1996 | 19,501 | 11,094 | 8,645 | 8,807 | 14,253 | 20,885 | 27,589 | 31,389 | 33,537 | 32,092 | 27,543 | 18,352 |
| 1997 | 9,378 | 6,835 | 8,941 | 11,029 | 15,222 | 22,994 | 30,919 | 36,113 | 39,348 | 40,231 | 37,689 | 24,500 |
| 1998 | 16,871 | 10,074 | 8,245 | 9,393 | 16,645 | 23,781 | 30,512 | 30,504 | 45,194 | 49,042 | 46,811 | 38,060 |
| 1999 | 27,575 | 21,389 | 15,651 | 13,987 | 17,759 | 24,348 | 31,701 | 36,419 | 41,209 | 43,073 | 42,116 | 29,734 |
| 2000 | 19,640 | 12,054 | 9,035 | 13,482 | 18,992 | 24,704 | 31,358 | 37,899 | 43,394 | 42,344 | 33,260 | 22,330 |
| 2001 | 10,053 | 6,022 | 8,829 | 13,236 | 20,491 | 26,861 | 34,040 | 39,979 | 47,362 | 47,644 | 44,722 | 35,053 |
| 2002 | 23,195 | 15,788 | 12,909 | 16,419 | 24,332 | 31,444 | 38,251 | 44,587 | 48,219 | 47,818 | 44,443 | 37,172 |
| 2003 | 30,134 | 21,829 | 20,589 | 28,348 | 32,800 | 37,091 | 38,167 | 40,093 | 44,275 | 48,082 | 42,475 | 32,431 |
| 2004 | 19,700 | 9,621 | 10,333 | 10,819 | 18,928 | 27,120 | 33,611 | 37,963 | 44,570 | 47,415 | 46,759 | 35,690 |
| 2005 | 24,592 | 15,075 | 14,119 | 14,383 | 21,399 | 29,578 | 35,624 | 38,957 | 44,330 | 47,768 | 44,845 | 35,633 |
| 2006 | 25,648 | 17,708 | 14,876 | 16,905 | 24,926 | 32,634 | 37,832 | 43,466 | 47,744 | 49,354 | 47,431 | 38,197 |
| 2007 | 26,484 | 18,006 | 14,540 | 14,378 | 20,464 | 26,350 | 31,469 | 37,784 | 44,756 | 47,184 | 47,522 | 36,950 |
| 2008 | 24,114 | 15,994 | 9,296 | 9,357 | 14,838 | 20,556 | 24,427 | 30,144 | 38,528 | 43,321 | 47,660 | 37,952 |
| 2009 | 27,194 | 21,257 | 18,757 | 21,141 | 29,910 | 37,602 | 36,977 | 40,687 | 45,111 | 45,670 | 48,034 | 38,227 |
| 2010 | 28,141 | 20,702 | 20,126 | 22,061 | 29,069 | 34,478 | 40,280 | 42,226 | 45,097 | 47,826 | 46,870 | 38,220 |
| 2011 | 25,127 | 15,851 | 12,724 | 10,985 | 17,149 | 25,147 | 33,011 | 39,116 | 46,187 | 49,433 | 51,940 | 45,989 |
| 2012 | 37,891 | 32,137 | 31,505 | 31,357 | 34,494 | 37,639 | 40,884 | 41,956 | 45,172 | 48,673 | 47,343 | 41,616 |
| 2013 | 31,897 | 27,491 | 23,249 | 23,559 | 28,013 | 31,690 | 35,111 | 39,609 | 42,609 | 44,014 | 42,159 | 29,879 |
| 2014 | 19,992 | 11,390 | 6,804 | 6,580 | 14,736 | 22,496 | 30,174 | 35,917 | 41,042 | 43,015 | 38,463 | 31,096 |
| 2015 | 24,848 | 21,599 | 21,796 | 22,277 | 28,538 | 33,648 | 39,435 | 42,617 | 46,940 | 48,342 | 45,211 | 39,027 |
| 2016 | 30,197 | 26,512 | 28,440 | 29,301 | 36,661 | 41,562 | 44,202 | 47,073 | 50,515 | 52,057 | 52,536 | 40,249 |
| 2017 | 28,347 | 23,013 | 23,531 | 26,159 | 33,453 | 38,614 | 42,332 | 43,780 | 48,122 | 49,722 | 49,900 | 37,563 |
| 2018 | 23,243 | 13,907 | 10,650 | 12,542 | 21,119 | 28,073 | 32,107 | 35,739 | 41,730 | 44,429 | 37,430 | 29,853 |
| 2019 | 19,805 | 11,421 | 6,034 | 10,514 | 18,182 | 25,975 | 33,238 | 38,107 | 44,773 | 47,110 | 44,456 | 34,095 |
| 2020 | 25,010 | 15,367 | 12,962 | 17,761 | 26,869 | 35,467 | 43,450 | 47,968 | 51,772 | 52,471 | 50,098 | 35,783 |
| 2021 | 26,620 | 17,097 | 21,760 | 25,448 | 34,642 | 41,581 | 44,518 | 46,623 | 48,325 | 49,561 | 49,340 | 37,530 |
| 2022 | 25,967 | 16,389 | 19,724 | 20,599 | 28,894 | 36,007 | 40,751 | 42,751 | 48,779 | 52,371 | 44,852 | 28,994 |
| 2023 | 17,458 | 8,876 | 5,556 | 9,225 | 19,514 | 29,317 | 37,018 | 45,099 | 50,721 | 53,021 | 50,745 | 44,276 |
| 2024 | 31,788 | 31,220 | ||||||||||
| - = No Data Reported; -- = Not Applicable; NA = Not Available; W = Withheld to avoid disclosure of individual company data. |
| Release Date: 4/30/2024 |
| Next Release Date: 5/31/2024 |