|
Download Data (XLS File) |
|
|||||
|
|||||
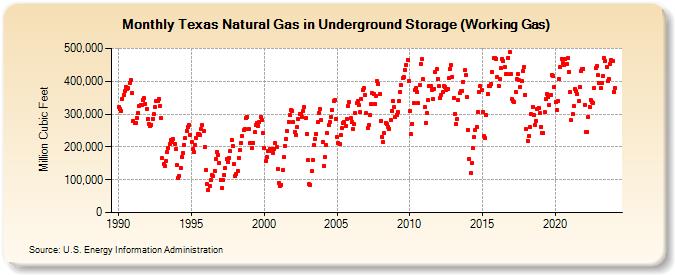
| Texas Natural Gas in Underground Storage (Working Gas) (Million Cubic Feet) | |||||
| Year | Jan | Feb | Mar | Apr | May | Jun | Jul | Aug | Sep | Oct | Nov | Dec |
|---|---|---|---|---|---|---|---|---|---|---|---|---|
| 1990 | 321,678 | 314,918 | 308,955 | 347,344 | 357,995 | 370,534 | 383,549 | 377,753 | 378,495 | 396,071 | 402,265 | 365,396 |
| 1991 | 279,362 | 271,469 | 271,401 | 289,226 | 303,895 | 323,545 | 327,350 | 329,102 | 344,201 | 347,984 | 331,821 | 316,648 |
| 1992 | 284,571 | 270,262 | 264,884 | 267,778 | 286,318 | 298,901 | 320,885 | 338,320 | 341,156 | 345,459 | 324,873 | 288,098 |
| 1993 | 165,226 | 149,367 | 141,472 | 157,250 | 183,990 | 198,041 | 207,344 | 220,032 | 216,071 | 222,798 | 210,181 | 194,014 |
| 1994 | 143,701 | 103,889 | 111,945 | 135,634 | 168,679 | 181,683 | 207,232 | 226,641 | 248,857 | 261,209 | 266,958 | 235,718 |
| 1995 | 215,449 | 192,489 | 184,914 | 206,178 | 228,388 | 238,593 | 238,850 | 234,779 | 254,339 | 265,781 | 248,336 | 200,382 |
| 1996 | 130,166 | 85,488 | 68,002 | 80,538 | 99,574 | 113,555 | 109,949 | 128,089 | 162,220 | 184,421 | 175,658 | 152,135 |
| 1997 | 100,354 | 76,028 | 97,852 | 114,818 | 135,975 | 163,607 | 153,250 | 165,932 | 186,026 | 220,540 | 202,090 | 147,607 |
| 1998 | 110,771 | 117,545 | 126,870 | 167,139 | 190,953 | 213,098 | 233,104 | 251,031 | 255,712 | 289,298 | 291,193 | 254,973 |
| 1999 | 211,780 | 213,050 | 197,826 | 213,178 | 244,572 | 266,139 | 273,831 | 264,716 | 276,127 | 289,858 | 281,052 | 242,410 |
| 2000 | 195,827 | 156,448 | 169,454 | 186,727 | 188,190 | 194,899 | 193,754 | 182,179 | 193,881 | 210,896 | 200,044 | 132,868 |
| 2001 | 90,189 | 82,056 | 85,047 | 128,204 | 168,758 | 203,164 | 224,416 | 247,704 | 276,780 | 297,420 | 311,716 | 310,785 |
| 2002 | 274,346 | 245,613 | 235,342 | 261,294 | 285,360 | 300,541 | 300,549 | 291,500 | 310,802 | 320,211 | 288,591 | 239,167 |
| 2003 | 158,959 | 87,236 | 85,320 | 125,611 | 160,146 | 204,688 | 224,781 | 240,493 | 274,343 | 304,316 | 314,016 | 280,464 |
| 2004 | 214,211 | 142,426 | 167,764 | 205,309 | 241,557 | 265,296 | 275,885 | 291,732 | 311,772 | 340,078 | 344,309 | 286,030 |
| 2005 | 230,618 | 211,222 | 207,305 | 237,652 | 256,622 | 273,049 | 275,000 | 263,943 | 283,544 | 323,654 | 335,614 | 287,045 |
| 2006 | 274,996 | 254,765 | 268,267 | 301,840 | 332,780 | 339,605 | 326,416 | 306,570 | 346,049 | 373,848 | 378,448 | 357,637 |
| 2007 | 301,829 | 257,096 | 265,167 | 296,750 | 330,384 | 363,587 | 361,268 | 330,958 | 355,829 | 399,383 | 392,170 | 359,775 |
| 2008 | 278,865 | 229,509 | 215,884 | 241,198 | 274,104 | 269,148 | 261,453 | 255,264 | 282,536 | 309,432 | 338,590 | 320,276 |
| 2009 | 291,333 | 297,237 | 306,001 | 339,030 | 368,566 | 387,363 | 409,632 | 413,325 | 434,856 | 450,294 | 465,877 | 401,120 |
| 2010 | 307,932 | 238,090 | 271,059 | 332,757 | 372,706 | 378,551 | 366,767 | 332,222 | 388,299 | 453,016 | 466,470 | 405,810 |
| 2011 | 320,345 | 274,265 | 303,053 | 342,037 | 386,260 | 385,120 | 374,146 | 345,744 | 376,495 | 427,063 | 435,993 | 408,037 |
| 2012 | 384,186 | 349,197 | 359,386 | 366,119 | 384,421 | 382,916 | 374,235 | 375,334 | 408,666 | 438,098 | 448,956 | 413,145 |
| 2013 | 348,589 | 301,579 | 270,838 | 286,424 | 342,362 | 362,930 | 370,000 | 371,281 | 398,529 | 432,769 | 418,284 | 352,215 |
| 2014 | 252,872 | 164,599 | 119,402 | 149,893 | 195,183 | 229,034 | 251,316 | 261,697 | 306,506 | 366,714 | 384,634 | 374,281 |
| 2015 | 307,710 | 232,292 | 228,206 | 296,391 | 361,017 | 384,847 | 386,186 | 392,583 | 428,110 | 470,258 | 471,593 | 469,012 |
| 2016 | 411,431 | 386,432 | 405,380 | 438,907 | 468,372 | 460,919 | 442,642 | 420,932 | 421,208 | 471,829 | 489,277 | 423,186 |
| 2017 | 345,023 | 338,811 | 336,962 | 367,892 | 405,485 | 421,138 | 402,490 | 383,195 | 401,054 | 431,085 | 443,064 | 358,898 |
| 2018 | 254,331 | 217,967 | 234,312 | 261,850 | 299,249 | 322,468 | 296,286 | 267,368 | 279,608 | 314,767 | 318,570 | 302,991 |
| 2019 | 261,677 | 243,209 | 241,882 | 306,162 | 344,777 | 362,451 | 351,079 | 328,459 | 359,538 | 418,805 | 416,200 | 380,928 |
| 2020 | 338,104 | 310,979 | 341,067 | 405,302 | 443,847 | 468,312 | 456,456 | 447,979 | 466,280 | 452,810 | 470,665 | 429,437 |
| 2021 | 366,023 | 280,432 | 299,158 | 323,595 | 375,994 | 370,019 | 360,180 | 339,759 | 382,958 | 431,071 | 436,713 | 438,618 |
| 2022 | 328,690 | 246,445 | 246,634 | 291,172 | 322,460 | 343,020 | 335,775 | 334,806 | 378,599 | 440,783 | 445,661 | 417,487 |
| 2023 | 394,359 | 378,107 | 394,207 | 416,400 | 470,940 | 461,639 | 444,124 | 400,282 | 407,548 | 453,602 | 464,640 | 461,605 |
| 2024 | 368,228 | 379,979 | ||||||||||
| - = No Data Reported; -- = Not Applicable; NA = Not Available; W = Withheld to avoid disclosure of individual company data. |
| Release Date: 4/30/2024 |
| Next Release Date: 5/31/2024 |