|
Download Data (XLS File) |
|
|||||
|
|||||
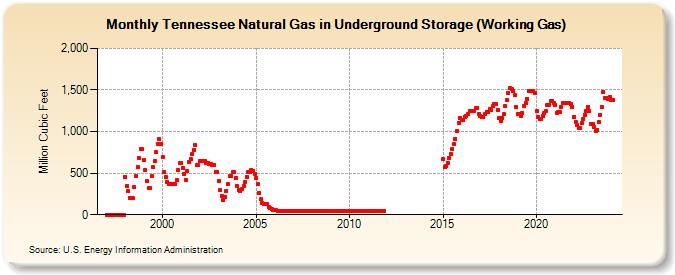
| Tennessee Natural Gas in Underground Storage (Working Gas) (Million Cubic Feet) | |||||
| Year | Jan | Feb | Mar | Apr | May | Jun | Jul | Aug | Sep | Oct | Nov | Dec |
|---|---|---|---|---|---|---|---|---|---|---|---|---|
| 1997 | 0 | 0 | 0 | 0 | 0 | 0 | 0 | 0 | 0 | 0 | 0 | 0 |
| 1998 | 459 | 343 | 283 | 199 | 199 | 199 | 333 | 467 | 579 | 682 | 786 | 787 |
| 1999 | 656 | 532 | 401 | 321 | 318 | 462 | 569 | 645 | 749 | 854 | 911 | 855 |
| 2000 | 691 | 515 | 452 | 389 | 371 | 371 | 371 | 371 | 371 | 420 | 534 | 619 |
| 2001 | 623 | 563 | 490 | 421 | 525 | 638 | 669 | 732 | 778 | 840 | 598 | 597 |
| 2002 | 647 | 648 | 650 | 650 | 625 | 622 | 609 | 605 | 602 | 600 | 512 | 512 |
| 2003 | 404 | 294 | 226 | 179 | 214 | 290 | 365 | 460 | 463 | 508 | 508 | 447 |
| 2004 | 344 | 293 | 281 | 312 | 345 | 391 | 454 | 509 | 514 | 539 | 527 | 486 |
| 2005 | 444 | 364 | 265 | 184 | 143 | 126 | 126 | 126 | 88 | 79 | 73 | 60 |
| 2006 | 52 | 52 | 44 | 44 | 44 | 44 | 44 | 44 | 44 | 44 | 44 | 44 |
| 2007 | 44 | 44 | 44 | 44 | 44 | 44 | 44 | 44 | 44 | 44 | 44 | 44 |
| 2008 | 44 | 44 | 44 | 44 | 44 | 44 | 44 | 44 | 44 | 44 | 44 | 44 |
| 2009 | 44 | 44 | 44 | 44 | 44 | 44 | 44 | 44 | 44 | 44 | 44 | 44 |
| 2010 | 44 | 44 | 44 | 44 | 44 | 44 | 44 | 44 | 44 | 44 | 44 | 44 |
| 2011 | 44 | 44 | 44 | 44 | 44 | 44 | 44 | 44 | 44 | 44 | 44 | |
| 2015 | 666 | 570 | 580 | 627 | 680 | 729 | 789 | 848 | 913 | 1,005 | 1,107 | 1,162 |
| 2016 | 1,137 | 1,143 | 1,175 | 1,192 | 1,217 | 1,253 | 1,253 | 1,248 | 1,245 | 1,279 | 1,289 | 1,217 |
| 2017 | 1,185 | 1,172 | 1,176 | 1,206 | 1,238 | 1,238 | 1,271 | 1,260 | 1,303 | 1,334 | 1,329 | 1,261 |
| 2018 | 1,157 | 1,132 | 1,162 | 1,206 | 1,302 | 1,377 | 1,459 | 1,518 | 1,516 | 1,492 | 1,434 | 1,296 |
| 2019 | 1,215 | 1,209 | 1,185 | 1,222 | 1,302 | 1,346 | 1,396 | 1,491 | 1,491 | 1,491 | 1,482 | 1,469 |
| 2020 | 1,245 | 1,173 | 1,145 | 1,145 | 1,187 | 1,218 | 1,253 | 1,322 | 1,322 | 1,372 | 1,370 | 1,347 |
| 2021 | 1,324 | 1,226 | 1,233 | 1,234 | 1,290 | 1,342 | 1,342 | 1,342 | 1,342 | 1,342 | 1,328 | 1,294 |
| 2022 | 1,179 | 1,117 | 1,073 | 1,047 | 1,047 | 1,098 | 1,156 | 1,205 | 1,251 | 1,300 | 1,248 | 1,096 |
| 2023 | 1,096 | 1,049 | 1,003 | 1,023 | 1,109 | 1,203 | 1,299 | 1,475 | 1,400 | 1,400 | 1,396 | 1,420 |
| 2024 | 1,385 | |||||||||||
| - = No Data Reported; -- = Not Applicable; NA = Not Available; W = Withheld to avoid disclosure of individual company data. |
| Release Date: 3/29/2024 |
| Next Release Date: 4/30/2024 |