|
Download Data (XLS File) |
|
|||||
|
|||||
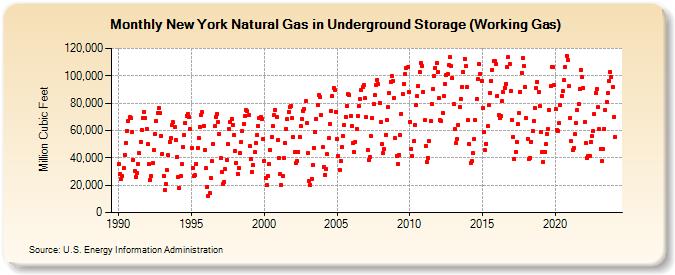
| New York Natural Gas in Underground Storage (Working Gas) (Million Cubic Feet) | |||||
| Year | Jan | Feb | Mar | Apr | May | Jun | Jul | Aug | Sep | Oct | Nov | Dec |
|---|---|---|---|---|---|---|---|---|---|---|---|---|
| 1990 | 35,239 | 28,083 | 24,437 | 26,484 | 32,304 | 42,192 | 50,845 | 59,950 | 66,681 | 69,508 | 68,996 | 59,183 |
| 1991 | 38,557 | 30,227 | 25,695 | 29,076 | 35,780 | 43,534 | 51,822 | 60,564 | 69,005 | 73,760 | 68,941 | 61,246 |
| 1992 | 49,781 | 35,441 | 23,732 | 26,771 | 36,307 | 45,716 | 57,152 | 66,993 | 72,724 | 76,134 | 72,836 | 56,289 |
| 1993 | 43,019 | 26,790 | 16,578 | 20,740 | 30,875 | 41,858 | 51,917 | 54,363 | 63,952 | 65,899 | 62,563 | 53,140 |
| 1994 | 40,502 | 26,320 | 17,867 | 26,755 | 35,465 | 47,773 | 56,880 | 65,819 | 70,776 | 72,168 | 69,544 | 60,807 |
| 1995 | 46,883 | 32,592 | 26,685 | 27,192 | 35,773 | 47,125 | 54,358 | 62,641 | 71,561 | 73,249 | 63,560 | 45,810 |
| 1996 | 32,291 | 18,859 | 12,303 | 14,165 | 25,352 | 37,383 | 50,196 | 63,009 | 69,771 | 72,401 | 65,927 | 57,571 |
| 1997 | 39,799 | 29,658 | 20,614 | 22,414 | 31,704 | 38,709 | 50,042 | 61,071 | 66,221 | 68,564 | 64,222 | 56,440 |
| 1998 | 45,232 | 36,471 | 28,550 | 32,772 | 43,712 | 51,716 | 59,375 | 64,963 | 70,607 | 75,039 | 74,189 | 71,048 |
| 1999 | 48,417 | 39,123 | 29,970 | 34,593 | 44,175 | 50,855 | 56,593 | 63,323 | 69,005 | 70,013 | 68,513 | 53,536 |
| 2000 | 38,018 | 25,500 | 20,136 | 26,732 | 35,452 | 45,409 | 55,361 | 62,963 | 71,003 | 75,058 | 69,990 | 52,742 |
| 2001 | 39,678 | 27,861 | 20,184 | 26,584 | 39,878 | 51,086 | 61,317 | 68,295 | 73,858 | 76,906 | 78,180 | 69,319 |
| 2002 | 54,900 | 43,919 | 36,453 | 37,647 | 44,530 | 55,484 | 63,193 | 68,695 | 74,208 | 75,844 | 81,226 | 65,636 |
| 2003 | 43,400 | 23,238 | 20,133 | 24,851 | 34,704 | 47,482 | 59,102 | 68,573 | 78,382 | 85,837 | 84,649 | 71,447 |
| 2004 | 47,684 | 33,543 | 27,794 | 32,099 | 42,457 | 54,434 | 64,931 | 74,552 | 84,843 | 91,321 | 89,360 | 73,391 |
| 2005 | 53,567 | 41,449 | 31,174 | 37,927 | 47,821 | 55,973 | 63,686 | 69,946 | 77,797 | 86,340 | 86,160 | 70,828 |
| 2006 | 63,238 | 50,768 | 44,601 | 51,798 | 61,321 | 70,532 | 77,705 | 82,998 | 89,858 | 91,698 | 93,072 | 83,531 |
| 2007 | 69,608 | 45,865 | 38,359 | 40,819 | 56,128 | 69,064 | 79,454 | 85,750 | 93,009 | 96,885 | 93,733 | 80,434 |
| 2008 | 65,952 | 50,107 | 43,252 | 46,349 | 56,933 | 67,406 | 76,832 | 87,493 | 95,440 | 99,931 | 96,290 | 83,607 |
| 2009 | 54,221 | 41,248 | 35,827 | 42,401 | 56,396 | 72,128 | 86,635 | 94,298 | 100,958 | 105,645 | 106,171 | 88,172 |
| 2010 | 66,525 | 46,714 | 41,229 | 52,110 | 64,334 | 78,348 | 84,982 | 92,385 | 102,624 | 109,644 | 107,231 | 88,150 |
| 2011 | 67,315 | 48,922 | 36,976 | 40,093 | 52,251 | 66,780 | 79,625 | 90,409 | 99,939 | 105,893 | 109,208 | 102,471 |
| 2012 | 83,433 | 67,397 | 66,790 | 72,756 | 84,979 | 94,187 | 100,250 | 101,151 | 107,855 | 113,686 | 107,018 | 98,301 |
| 2013 | 79,246 | 60,994 | 50,480 | 53,849 | 64,243 | 77,239 | 83,256 | 91,930 | 102,873 | 112,457 | 106,978 | 91,474 |
| 2014 | 67,387 | 50,066 | 36,328 | 37,362 | 43,173 | 53,884 | 67,453 | 83,261 | 97,504 | 108,554 | 101,616 | 96,469 |
| 2015 | 76,258 | 59,152 | 45,373 | 50,206 | 63,033 | 78,321 | 87,707 | 96,186 | 104,520 | 110,600 | 110,550 | 108,540 |
| 2016 | 85,557 | 71,217 | 68,794 | 70,604 | 81,684 | 87,845 | 91,230 | 94,130 | 106,378 | 113,377 | 108,679 | 88,546 |
| 2017 | 67,745 | 55,513 | 38,991 | 44,438 | 51,686 | 64,465 | 72,707 | 88,481 | 102,207 | 113,052 | 107,294 | 91,800 |
| 2018 | 68,998 | 53,813 | 39,189 | 40,176 | 51,915 | 59,834 | 66,739 | 76,200 | 90,732 | 95,685 | 88,261 | 77,585 |
| 2019 | 58,926 | 44,343 | 36,985 | 44,313 | 49,845 | 57,623 | 61,240 | 74,835 | 92,238 | 106,451 | 106,350 | 92,974 |
| 2020 | 75,452 | 60,612 | 59,693 | 65,353 | 78,672 | 85,100 | 88,533 | 96,580 | 106,467 | 114,646 | 111,748 | 92,405 |
| 2021 | 69,394 | 52,100 | 45,365 | 47,303 | 57,404 | 65,351 | 74,899 | 79,132 | 90,378 | 104,143 | 98,978 | 91,206 |
| 2022 | 66,514 | 50,728 | 39,830 | 41,504 | 41,479 | 51,777 | 55,598 | 59,526 | 71,912 | 87,295 | 90,275 | 76,802 |
| 2023 | 60,879 | 46,606 | 37,346 | 46,456 | 61,401 | 74,741 | 81,175 | 87,121 | 96,199 | 103,068 | 99,328 | 92,137 |
| 2024 | 69,905 | 55,269 | ||||||||||
| - = No Data Reported; -- = Not Applicable; NA = Not Available; W = Withheld to avoid disclosure of individual company data. |
| Release Date: 4/30/2024 |
| Next Release Date: 5/31/2024 |