|
Download Data (XLS File) |
|
|||||
|
|||||
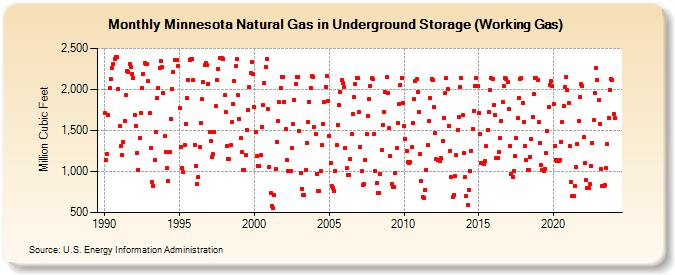
| Minnesota Natural Gas in Underground Storage (Working Gas) (Million Cubic Feet) | |||||
| Year | Jan | Feb | Mar | Apr | May | Jun | Jul | Aug | Sep | Oct | Nov | Dec |
|---|---|---|---|---|---|---|---|---|---|---|---|---|
| 1990 | 1,708 | 1,141 | 1,211 | 1,688 | 2,017 | 2,129 | 2,261 | 2,309 | 2,370 | 2,397 | 2,395 | 2,007 |
| 1991 | 1,551 | 1,313 | 1,207 | 1,362 | 1,619 | 1,931 | 2,222 | 2,214 | 2,307 | 2,273 | 2,191 | 2,134 |
| 1992 | 1,685 | 1,556 | 1,228 | 1,019 | 1,409 | 1,716 | 2,013 | 2,193 | 2,319 | 2,315 | 2,307 | 2,104 |
| 1993 | 1,708 | 1,290 | 872 | 824 | 1,141 | 1,485 | 1,894 | 2,022 | 2,260 | 2,344 | 2,268 | 1,957 |
| 1994 | 1,430 | 1,235 | 1,045 | 888 | 1,237 | 1,642 | 2,011 | 2,213 | 2,362 | 2,360 | 2,356 | 2,284 |
| 1995 | 1,771 | 1,294 | 1,037 | 990 | 1,321 | 1,584 | 1,890 | 2,121 | 2,362 | 2,368 | 2,365 | 2,110 |
| 1996 | 1,329 | 1,069 | 847 | 935 | 1,301 | 1,596 | 1,883 | 2,093 | 2,295 | 2,328 | 2,297 | 2,070 |
| 1997 | 1,482 | 1,366 | 1,177 | 1,208 | 1,481 | 1,793 | 2,114 | 2,252 | 2,381 | 2,381 | 2,377 | 2,372 |
| 1998 | 1,928 | 1,725 | 1,309 | 1,150 | 1,151 | 1,320 | 1,609 | 1,823 | 2,098 | 2,284 | 2,369 | 1,931 |
| 1999 | 1,643 | 1,405 | 1,238 | 1,024 | 1,024 | 1,196 | 1,504 | 1,755 | 2,027 | 2,202 | 2,330 | 2,183 |
| 2000 | 1,783 | 1,484 | 1,184 | 1,068 | 1,066 | 1,197 | 1,540 | 1,812 | 2,078 | 2,277 | 2,369 | 1,765 |
| 2001 | 1,059 | 736 | 582 | 559 | 711 | 1,029 | 1,358 | 1,617 | 1,848 | 2,022 | 2,157 | 2,154 |
| 2002 | 1,850 | 1,518 | 1,143 | 1,009 | 1,010 | 1,010 | 1,286 | 1,574 | 1,874 | 2,072 | 2,156 | 2,151 |
| 2003 | 1,492 | 988 | 789 | 708 | 708 | 1,016 | 1,347 | 1,607 | 1,846 | 2,022 | 2,158 | 2,154 |
| 2004 | 1,542 | 1,457 | 973 | 758 | 758 | 1,004 | 1,324 | 1,576 | 1,846 | 2,030 | 2,159 | 1,860 |
| 2005 | 1,438 | 1,098 | 821 | 802 | 766 | 1,010 | 1,321 | 1,565 | 1,809 | 1,966 | 2,109 | 2,076 |
| 2006 | 2,024 | 1,284 | 1,040 | 959 | 959 | 1,150 | 1,460 | 1,703 | 1,905 | 2,063 | 2,143 | 2,139 |
| 2007 | 1,727 | 1,294 | 1,001 | 836 | 845 | 1,145 | 1,455 | 1,674 | 1,878 | 2,040 | 2,139 | 2,124 |
| 2008 | 1,458 | 1,012 | 857 | 737 | 737 | 974 | 1,261 | 1,563 | 1,731 | 1,963 | 2,153 | 1,956 |
| 2009 | 1,525 | 1,194 | 848 | 809 | 809 | 983 | 1,285 | 1,594 | 1,826 | 2,055 | 2,144 | 1,837 |
| 2010 | 1,559 | 1,401 | 1,247 | 1,112 | 1,106 | 1,111 | 1,294 | 1,590 | 1,882 | 2,108 | 2,127 | 1,972 |
| 2011 | 1,731 | 1,212 | 886 | 685 | 679 | 780 | 1,022 | 1,324 | 1,617 | 1,898 | 2,127 | 2,116 |
| 2012 | 1,786 | 1,471 | 1,149 | 1,143 | 1,137 | 1,131 | 1,159 | 1,369 | 1,656 | 1,961 | 2,141 | 2,011 |
| 2013 | 1,558 | 1,251 | 929 | 687 | 715 | 941 | 1,203 | 1,506 | 1,668 | 2,026 | 2,138 | 1,683 |
| 2014 | 1,222 | 938 | 698 | 595 | 778 | 1,003 | 1,250 | 1,520 | 1,743 | 2,037 | 2,144 | 2,047 |
| 2015 | 1,711 | 1,455 | 1,104 | 1,098 | 1,092 | 1,128 | 1,305 | 1,507 | 1,725 | 1,987 | 2,136 | 2,125 |
| 2016 | 1,810 | 1,683 | 1,168 | 1,161 | 1,237 | 1,411 | 1,616 | 1,844 | 2,041 | 2,145 | 2,131 | 2,087 |
| 2017 | 1,766 | 1,315 | 973 | 938 | 1,001 | 1,190 | 1,410 | 1,654 | 1,896 | 2,128 | 2,137 | 1,839 |
| 2018 | 1,601 | 1,311 | 1,135 | 1,023 | 1,017 | 1,179 | 1,400 | 1,669 | 1,948 | 2,144 | 2,134 | 2,113 |
| 2019 | 1,600 | 1,350 | 1,074 | 1,015 | 1,009 | 1,032 | 1,224 | 1,497 | 1,785 | 2,055 | 2,108 | 2,038 |
| 2020 | 1,822 | 1,310 | 1,146 | 1,133 | 1,127 | 1,144 | 1,365 | 1,600 | 1,804 | 2,032 | 2,150 | 1,987 |
| 2021 | 1,832 | 1,307 | 876 | 707 | 702 | 821 | 1,058 | 1,337 | 1,616 | 1,909 | 2,070 | 2,042 |
| 2022 | 1,419 | 1,102 | 898 | 801 | 795 | 847 | 1,070 | 1,345 | 1,624 | 1,961 | 2,267 | 2,110 |
| 2023 | 1,866 | 1,579 | 1,031 | 824 | 818 | 835 | 1,045 | 1,330 | 1,655 | 1,994 | 2,132 | 2,114 |
| 2024 | 1,706 | 1,648 | ||||||||||
| - = No Data Reported; -- = Not Applicable; NA = Not Available; W = Withheld to avoid disclosure of individual company data. |
| Release Date: 4/30/2024 |
| Next Release Date: 5/31/2024 |