|
Download Data (XLS File) |
|
|||||
|
|||||
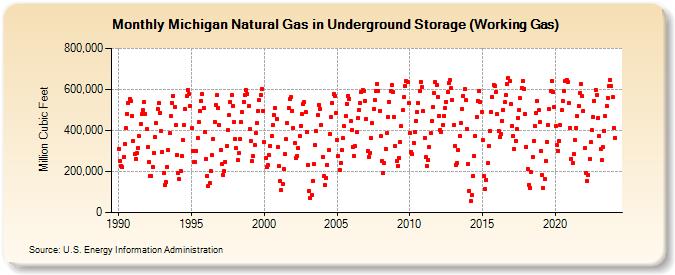
| Michigan Natural Gas in Underground Storage (Working Gas) (Million Cubic Feet) | |||||
| Year | Jan | Feb | Mar | Apr | May | Jun | Jul | Aug | Sep | Oct | Nov | Dec |
|---|---|---|---|---|---|---|---|---|---|---|---|---|
| 1990 | 311,360 | 252,796 | 228,986 | 221,127 | 269,595 | 333,981 | 410,982 | 481,628 | 534,303 | 553,823 | 542,931 | 472,150 |
| 1991 | 348,875 | 285,217 | 262,424 | 287,946 | 315,457 | 372,989 | 431,607 | 478,293 | 498,086 | 539,454 | 481,257 | 405,327 |
| 1992 | 320,447 | 244,921 | 179,503 | 179,306 | 224,257 | 292,516 | 367,408 | 435,817 | 504,312 | 532,896 | 486,495 | 397,280 |
| 1993 | 296,403 | 194,201 | 133,273 | 148,416 | 222,106 | 303,407 | 386,359 | 468,790 | 534,882 | 568,552 | 516,491 | 426,536 |
| 1994 | 282,144 | 193,338 | 162,719 | 203,884 | 276,787 | 351,286 | 425,738 | 502,577 | 568,235 | 599,504 | 579,874 | 516,887 |
| 1995 | 410,946 | 298,325 | 247,016 | 245,903 | 299,050 | 364,569 | 438,995 | 492,773 | 545,157 | 577,585 | 511,573 | 392,896 |
| 1996 | 261,613 | 179,351 | 128,949 | 142,937 | 201,096 | 279,977 | 360,428 | 443,035 | 522,243 | 571,298 | 510,534 | 427,244 |
| 1997 | 305,929 | 235,262 | 181,770 | 200,838 | 248,353 | 323,082 | 400,146 | 473,248 | 538,650 | 572,170 | 519,981 | 443,087 |
| 1998 | 359,243 | 312,905 | 256,850 | 288,584 | 358,138 | 439,460 | 488,164 | 540,475 | 570,953 | 598,086 | 579,515 | 518,919 |
| 1999 | 406,535 | 349,057 | 249,237 | 273,602 | 328,415 | 386,535 | 437,835 | 496,005 | 547,211 | 571,931 | 602,997 | 494,942 |
| 2000 | 345,066 | 266,275 | 221,814 | 230,392 | 278,742 | 324,362 | 374,247 | 427,300 | 474,762 | 511,469 | 457,631 | 319,830 |
| 2001 | 226,045 | 152,208 | 109,653 | 140,068 | 211,415 | 283,950 | 356,433 | 435,631 | 508,502 | 553,395 | 561,446 | 496,357 |
| 2002 | 411,658 | 338,686 | 264,295 | 274,785 | 314,354 | 372,511 | 424,009 | 478,162 | 527,910 | 536,941 | 490,990 | 393,306 |
| 2003 | 231,632 | 106,019 | 69,022 | 85,396 | 151,783 | 236,246 | 328,643 | 399,841 | 473,760 | 526,100 | 506,080 | 425,619 |
| 2004 | 272,518 | 176,832 | 135,337 | 170,252 | 233,132 | 303,958 | 383,305 | 464,686 | 535,454 | 578,242 | 567,591 | 485,625 |
| 2005 | 354,630 | 275,175 | 207,340 | 242,838 | 303,422 | 361,850 | 419,416 | 472,176 | 530,471 | 570,168 | 555,525 | 444,877 |
| 2006 | 401,865 | 321,455 | 277,178 | 323,010 | 392,093 | 459,297 | 500,345 | 536,195 | 588,461 | 599,588 | 592,875 | 545,584 |
| 2007 | 455,147 | 299,353 | 269,905 | 289,228 | 362,415 | 436,035 | 503,751 | 546,110 | 593,049 | 626,963 | 594,726 | 496,961 |
| 2008 | 370,901 | 250,651 | 191,866 | 239,730 | 310,306 | 385,427 | 465,917 | 540,277 | 594,762 | 622,227 | 586,748 | 466,282 |
| 2009 | 324,198 | 251,280 | 225,867 | 267,557 | 341,986 | 420,394 | 498,996 | 561,712 | 616,329 | 640,990 | 636,260 | 534,468 |
| 2010 | 386,686 | 296,900 | 283,003 | 340,777 | 391,664 | 446,353 | 489,188 | 534,148 | 594,203 | 638,414 | 610,535 | 492,672 |
| 2011 | 365,306 | 268,585 | 227,133 | 258,346 | 319,997 | 385,424 | 445,467 | 513,485 | 583,958 | 634,518 | 620,623 | 564,008 |
| 2012 | 472,046 | 403,482 | 394,335 | 427,256 | 472,749 | 510,924 | 540,992 | 585,735 | 631,084 | 644,707 | 605,551 | 549,466 |
| 2013 | 427,422 | 323,411 | 233,514 | 241,597 | 304,260 | 374,210 | 437,217 | 504,182 | 569,561 | 600,344 | 546,471 | 409,079 |
| 2014 | 236,393 | 107,424 | 56,081 | 87,286 | 178,405 | 276,320 | 373,589 | 466,063 | 544,982 | 590,735 | 539,533 | 492,201 |
| 2015 | 353,242 | 177,059 | 116,068 | 159,074 | 241,221 | 323,709 | 398,647 | 488,022 | 563,188 | 622,544 | 619,041 | 587,562 |
| 2016 | 479,240 | 398,588 | 368,547 | 382,421 | 447,901 | 500,588 | 536,387 | 573,046 | 627,790 | 655,700 | 638,670 | 530,038 |
| 2017 | 421,323 | 374,036 | 310,454 | 350,364 | 405,561 | 462,894 | 501,641 | 556,099 | 608,440 | 643,077 | 603,765 | 482,439 |
| 2018 | 320,901 | 213,558 | 135,660 | 122,095 | 195,238 | 271,275 | 347,650 | 421,946 | 487,275 | 541,984 | 497,846 | 438,887 |
| 2019 | 300,074 | 184,774 | 120,914 | 165,003 | 251,835 | 345,785 | 426,852 | 503,801 | 590,163 | 640,655 | 585,948 | 512,430 |
| 2020 | 424,036 | 328,722 | 301,890 | 347,779 | 427,185 | 497,399 | 543,013 | 592,269 | 642,652 | 648,034 | 637,893 | 533,869 |
| 2021 | 413,850 | 262,666 | 240,864 | 285,816 | 351,188 | 412,372 | 468,740 | 520,779 | 584,992 | 625,377 | 566,243 | 495,956 |
| 2022 | 313,638 | 193,916 | 156,100 | 183,397 | 263,415 | 341,992 | 399,952 | 467,377 | 545,449 | 599,089 | 573,560 | 460,388 |
| 2023 | 374,777 | 308,184 | 255,723 | 319,356 | 398,334 | 468,531 | 518,298 | 559,267 | 614,498 | 647,193 | 614,425 | 560,842 |
| 2024 | 415,668 | |||||||||||
| - = No Data Reported; -- = Not Applicable; NA = Not Available; W = Withheld to avoid disclosure of individual company data. |
| Release Date: 3/29/2024 |
| Next Release Date: 4/30/2024 |