|
Download Data (XLS File) |
|
|||||
|
|||||
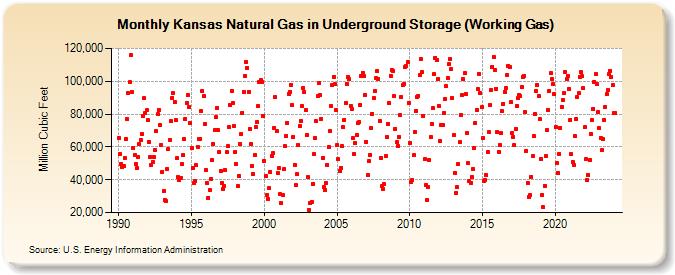
| Kansas Natural Gas in Underground Storage (Working Gas) (Million Cubic Feet) | |||||
| Year | Jan | Feb | Mar | Apr | May | Jun | Jul | Aug | Sep | Oct | Nov | Dec |
|---|---|---|---|---|---|---|---|---|---|---|---|---|
| 1990 | 65,683 | 55,509 | 49,604 | 47,540 | 48,128 | 53,233 | 64,817 | 76,933 | 92,574 | 99,253 | 115,704 | 93,290 |
| 1991 | 59,383 | 54,864 | 49,504 | 47,409 | 53,752 | 61,489 | 64,378 | 67,930 | 78,575 | 89,747 | 80,663 | 82,273 |
| 1992 | 76,311 | 63,152 | 53,718 | 48,998 | 51,053 | 53,700 | 57,987 | 69,653 | 79,756 | 82,541 | 73,094 | 61,456 |
| 1993 | 44,893 | 33,024 | 27,680 | 26,796 | 46,806 | 58,528 | 64,198 | 75,616 | 89,955 | 92,825 | 87,252 | 76,184 |
| 1994 | 52,998 | 41,644 | 39,796 | 40,779 | 49,519 | 55,059 | 64,664 | 77,229 | 86,820 | 91,309 | 84,568 | 74,364 |
| 1995 | 59,292 | 47,263 | 37,998 | 39,071 | 48,761 | 60,148 | 65,093 | 65,081 | 81,654 | 93,880 | 90,905 | 73,982 |
| 1996 | 45,800 | 38,190 | 29,089 | 33,932 | 40,701 | 51,829 | 61,997 | 70,113 | 78,002 | 83,839 | 70,117 | 56,939 |
| 1997 | 45,372 | 37,813 | 34,636 | 36,089 | 45,628 | 56,750 | 60,496 | 71,940 | 85,480 | 94,258 | 86,433 | 72,981 |
| 1998 | 57,185 | 49,391 | 36,036 | 42,572 | 61,565 | 67,704 | 80,896 | 93,247 | 103,278 | 111,881 | 108,279 | 93,604 |
| 1999 | 71,169 | 61,942 | 48,612 | 43,741 | 55,030 | 72,157 | 75,184 | 85,033 | 99,564 | 100,528 | 99,783 | 78,996 |
| 2000 | 51,674 | 42,078 | 30,658 | 28,348 | 34,833 | 44,767 | 54,543 | 56,187 | 71,681 | 90,447 | 69,707 | 43,816 |
| 2001 | 47,053 | 31,025 | 25,788 | 30,955 | 46,363 | 60,270 | 66,875 | 74,668 | 92,282 | 93,524 | 97,885 | 85,498 |
| 2002 | 66,133 | 49,240 | 36,518 | 43,274 | 61,085 | 72,676 | 75,647 | 84,860 | 95,909 | 93,669 | 82,461 | 67,228 |
| 2003 | 41,804 | 21,717 | 25,991 | 26,640 | 37,644 | 55,783 | 65,633 | 75,589 | 91,033 | 98,794 | 91,363 | 77,144 |
| 2004 | 53,273 | 35,366 | 33,985 | 37,974 | 49,081 | 59,809 | 69,660 | 84,769 | 97,782 | 102,839 | 98,090 | 82,382 |
| 2005 | 61,263 | 52,458 | 45,528 | 47,424 | 60,283 | 71,947 | 76,637 | 86,806 | 98,333 | 102,805 | 101,265 | 84,938 |
| 2006 | 83,099 | 65,270 | 55,887 | 62,141 | 67,181 | 74,331 | 75,221 | 85,564 | 102,902 | 105,274 | 102,929 | 91,842 |
| 2007 | 63,227 | 42,693 | 51,202 | 55,307 | 71,747 | 80,237 | 89,695 | 93,836 | 101,679 | 106,506 | 101,610 | 76,038 |
| 2008 | 53,245 | 36,112 | 34,438 | 37,179 | 54,160 | 65,916 | 73,912 | 86,722 | 103,486 | 107,042 | 106,015 | 90,976 |
| 2009 | 71,100 | 62,725 | 60,666 | 66,202 | 79,333 | 90,329 | 97,505 | 98,485 | 108,749 | 109,460 | 111,509 | 86,900 |
| 2010 | 62,590 | 38,586 | 39,903 | 54,857 | 69,350 | 82,045 | 90,331 | 91,275 | 103,567 | 113,794 | 105,525 | 79,024 |
| 2011 | 52,518 | 36,857 | 27,847 | 35,616 | 51,721 | 66,077 | 74,140 | 83,448 | 104,199 | 114,448 | 112,660 | 101,301 |
| 2012 | 84,812 | 63,527 | 73,235 | 73,478 | 80,909 | 89,196 | 96,935 | 101,800 | 110,386 | 113,584 | 107,181 | 89,680 |
| 2013 | 67,300 | 43,980 | 31,795 | 35,397 | 49,412 | 62,788 | 79,590 | 91,496 | 101,169 | 105,004 | 92,086 | 68,443 |
| 2014 | 50,068 | 39,028 | 37,899 | 41,897 | 46,556 | 59,346 | 74,724 | 82,622 | 95,228 | 104,484 | 92,749 | 84,112 |
| 2015 | 65,653 | 39,267 | 40,025 | 42,807 | 56,950 | 68,818 | 85,573 | 94,822 | 108,867 | 114,780 | 106,944 | 95,567 |
| 2016 | 69,026 | 57,113 | 61,183 | 68,354 | 81,622 | 86,323 | 93,701 | 95,798 | 103,956 | 109,534 | 108,658 | 87,191 |
| 2017 | 68,384 | 66,147 | 60,901 | 71,154 | 85,093 | 89,750 | 91,832 | 91,176 | 96,599 | 102,585 | 103,457 | 80,986 |
| 2018 | 57,678 | 38,036 | 29,425 | 30,393 | 41,953 | 54,257 | 66,401 | 80,076 | 94,157 | 97,847 | 90,934 | 76,723 |
| 2019 | 52,698 | 30,736 | 23,113 | 36,455 | 54,293 | 70,103 | 82,521 | 94,145 | 104,738 | 101,175 | 98,363 | 91,944 |
| 2020 | 72,011 | 50,212 | 44,268 | 55,966 | 71,540 | 84,502 | 88,749 | 92,959 | 105,853 | 101,091 | 103,328 | 95,288 |
| 2021 | 76,623 | 55,423 | 50,833 | 49,153 | 66,700 | 76,924 | 90,292 | 92,542 | 102,678 | 105,449 | 102,944 | 95,674 |
| 2022 | 71,951 | 52,362 | 39,902 | 42,752 | 51,751 | 68,058 | 76,482 | 83,365 | 99,783 | 104,183 | 98,218 | 81,361 |
| 2023 | 71,402 | 65,522 | 57,813 | 64,667 | 76,410 | 84,451 | 92,055 | 94,412 | 104,231 | 106,522 | 102,770 | 97,702 |
| 2024 | 80,432 | 80,671 | ||||||||||
| - = No Data Reported; -- = Not Applicable; NA = Not Available; W = Withheld to avoid disclosure of individual company data. |
| Release Date: 4/30/2024 |
| Next Release Date: 5/31/2024 |