|
Download Data (XLS File) |
|
|||||
|
|||||
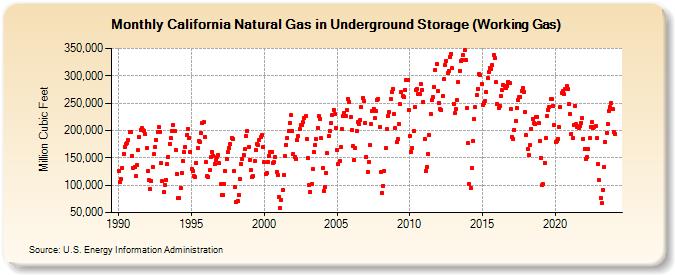
| California Natural Gas in Underground Storage (Working Gas) (Million Cubic Feet) | |||||
| Year | Jan | Feb | Mar | Apr | May | Jun | Jul | Aug | Sep | Oct | Nov | Dec |
|---|---|---|---|---|---|---|---|---|---|---|---|---|
| 1990 | 125,898 | 106,575 | 111,248 | 132,203 | 157,569 | 170,689 | 174,950 | 177,753 | 182,291 | 196,681 | 196,382 | 153,841 |
| 1991 | 132,323 | 132,935 | 115,982 | 136,883 | 163,570 | 187,887 | 201,443 | 204,342 | 199,994 | 199,692 | 193,096 | 168,789 |
| 1992 | 125,777 | 109,000 | 93,277 | 107,330 | 134,128 | 156,158 | 170,112 | 182,680 | 197,049 | 207,253 | 197,696 | 140,662 |
| 1993 | 106,890 | 87,612 | 100,869 | 109,975 | 138,272 | 152,044 | 175,917 | 185,337 | 199,629 | 210,423 | 198,700 | 164,518 |
| 1994 | 121,221 | 77,055 | 76,162 | 95,079 | 123,190 | 143,437 | 161,081 | 170,434 | 191,319 | 203,562 | 186,826 | 161,202 |
| 1995 | 130,241 | 125,591 | 117,650 | 114,852 | 141,222 | 167,231 | 181,227 | 179,508 | 194,712 | 212,867 | 214,897 | 188,927 |
| 1996 | 141,638 | 116,357 | 115,066 | 127,152 | 150,878 | 160,771 | 153,935 | 138,797 | 145,774 | 152,316 | 155,358 | 139,828 |
| 1997 | 101,408 | 81,666 | 82,106 | 101,326 | 125,374 | 148,565 | 159,966 | 168,397 | 175,218 | 187,058 | 184,316 | 125,878 |
| 1998 | 96,037 | 68,980 | 71,237 | 81,947 | 111,181 | 138,726 | 148,204 | 155,486 | 165,571 | 189,523 | 199,564 | 169,861 |
| 1999 | 146,115 | 127,650 | 114,166 | 116,749 | 143,806 | 164,545 | 175,745 | 172,828 | 182,602 | 187,442 | 192,155 | 168,993 |
| 2000 | 141,683 | 119,821 | 122,973 | 142,860 | 153,827 | 160,617 | 160,136 | 140,787 | 142,053 | 152,283 | 125,007 | 118,266 |
| 2001 | 79,227 | 59,016 | 73,846 | 91,212 | 118,670 | 153,135 | 174,170 | 186,713 | 198,664 | 214,162 | 228,261 | 199,870 |
| 2002 | 156,587 | 152,013 | 147,206 | 182,257 | 189,405 | 202,336 | 209,751 | 209,790 | 214,844 | 223,323 | 226,420 | 184,624 |
| 2003 | 149,320 | 100,020 | 88,124 | 101,758 | 129,843 | 160,339 | 173,535 | 183,605 | 205,086 | 225,742 | 221,385 | 185,742 |
| 2004 | 131,712 | 88,978 | 96,326 | 122,761 | 158,232 | 189,262 | 198,958 | 213,628 | 228,948 | 238,197 | 229,863 | 204,074 |
| 2005 | 163,928 | 138,061 | 143,698 | 168,996 | 202,787 | 226,518 | 231,221 | 226,599 | 237,726 | 257,067 | 252,738 | 224,575 |
| 2006 | 201,241 | 170,835 | 146,322 | 168,607 | 199,399 | 215,998 | 212,252 | 219,448 | 242,395 | 259,502 | 254,182 | 213,883 |
| 2007 | 152,148 | 124,681 | 142,672 | 173,864 | 211,280 | 236,093 | 239,716 | 222,556 | 235,501 | 256,108 | 258,384 | 206,746 |
| 2008 | 123,375 | 86,350 | 98,892 | 125,535 | 167,825 | 202,599 | 227,268 | 234,141 | 257,215 | 271,147 | 276,259 | 230,391 |
| 2009 | 204,335 | 178,362 | 183,883 | 211,704 | 247,636 | 269,670 | 263,628 | 260,456 | 274,583 | 292,341 | 291,701 | 238,070 |
| 2010 | 189,781 | 161,351 | 168,791 | 199,493 | 242,672 | 273,232 | 276,101 | 266,074 | 267,514 | 285,604 | 274,475 | 251,944 |
| 2011 | 184,034 | 126,246 | 133,974 | 156,691 | 191,869 | 229,711 | 255,039 | 261,528 | 280,274 | 311,340 | 321,308 | 272,482 |
| 2012 | 250,971 | 238,531 | 237,678 | 262,155 | 293,754 | 320,132 | 326,632 | 304,980 | 309,417 | 335,101 | 340,449 | 313,546 |
| 2013 | 248,960 | 231,190 | 238,808 | 255,453 | 287,757 | 309,448 | 326,906 | 329,024 | 338,271 | 346,466 | 329,422 | 240,846 |
| 2014 | 176,998 | 102,010 | 94,404 | 131,770 | 180,023 | 221,189 | 242,133 | 264,186 | 276,505 | 303,388 | 300,497 | 285,760 |
| 2015 | 246,844 | 249,419 | 253,738 | 270,205 | 295,665 | 306,004 | 314,527 | 312,769 | 319,349 | 337,762 | 332,064 | 287,977 |
| 2016 | 247,760 | 240,467 | 245,272 | 262,533 | 274,613 | 282,379 | 281,592 | 277,342 | 280,725 | 289,316 | 287,380 | 238,884 |
| 2017 | 188,663 | 184,363 | 201,636 | 217,775 | 241,221 | 255,156 | 261,981 | 260,839 | 273,001 | 277,431 | 271,201 | 233,300 |
| 2018 | 191,312 | 165,708 | 155,245 | 173,871 | 202,954 | 221,427 | 213,052 | 212,732 | 224,882 | 225,247 | 214,136 | 181,069 |
| 2019 | 150,441 | 100,148 | 101,590 | 140,671 | 186,198 | 225,656 | 237,108 | 243,369 | 256,845 | 258,161 | 245,616 | 209,672 |
| 2020 | 179,090 | 180,328 | 184,234 | 206,326 | 243,606 | 268,312 | 271,305 | 265,953 | 276,627 | 280,628 | 276,106 | 247,990 |
| 2021 | 230,831 | 193,970 | 185,511 | 209,946 | 245,277 | 210,966 | 205,572 | 204,001 | 207,476 | 214,034 | 222,581 | 185,299 |
| 2022 | 166,746 | 148,243 | 151,141 | 166,514 | 185,758 | 207,079 | 215,460 | 204,152 | 206,817 | 207,544 | 185,516 | 138,052 |
| 2023 | 108,623 | 77,094 | 66,660 | 92,074 | 133,641 | 179,020 | 195,604 | 211,646 | 236,058 | 242,200 | 249,305 | 239,569 |
| 2024 | 196,347 | 194,413 | ||||||||||
| - = No Data Reported; -- = Not Applicable; NA = Not Available; W = Withheld to avoid disclosure of individual company data. |
| Release Date: 4/30/2024 |
| Next Release Date: 5/31/2024 |