|
Download Data (XLS File) |
|
|||||
|
|||||
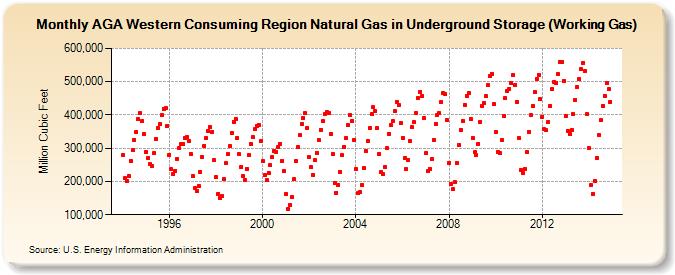
| AGA Western Consuming Region Natural Gas in Underground Storage (Working Gas) (Million Cubic Feet) | |||||
| Year | Jan | Feb | Mar | Apr | May | Jun | Jul | Aug | Sep | Oct | Nov | Dec |
|---|---|---|---|---|---|---|---|---|---|---|---|---|
| 1994 | 280,414 | 208,968 | 200,997 | 216,283 | 261,894 | 293,909 | 326,049 | 349,274 | 387,670 | 405,477 | 381,931 | 342,394 |
| 1995 | 288,908 | 270,955 | 251,410 | 246,654 | 284,291 | 328,371 | 362,156 | 372,718 | 398,444 | 418,605 | 419,849 | 366,944 |
| 1996 | 280,620 | 236,878 | 221,371 | 232,189 | 268,812 | 299,619 | 312,736 | 313,747 | 330,116 | 333,134 | 322,501 | 282,392 |
| 1997 | 216,113 | 179,067 | 171,563 | 184,918 | 227,756 | 273,507 | 306,641 | 330,075 | 351,975 | 363,189 | 350,107 | 263,455 |
| 1998 | 211,982 | 163,084 | 150,923 | 155,766 | 206,048 | 254,643 | 281,422 | 305,746 | 346,135 | 379,917 | 388,380 | 330,906 |
| 1999 | 281,497 | 243,483 | 215,508 | 204,306 | 238,532 | 278,386 | 313,698 | 332,949 | 356,640 | 366,154 | 369,479 | 320,746 |
| 2000 | 260,352 | 218,203 | 204,536 | 226,739 | 248,361 | 272,932 | 292,597 | 289,200 | 303,202 | 312,813 | 262,358 | 230,976 |
| 2001 | 162,888 | 118,489 | 130,353 | 153,946 | 206,402 | 260,357 | 303,396 | 338,138 | 373,648 | 392,169 | 404,638 | 360,698 |
| 2002 | 273,351 | 242,951 | 219,625 | 263,803 | 286,456 | 323,674 | 356,161 | 381,658 | 403,336 | 409,082 | 406,463 | 343,612 |
| 2003 | 281,511 | 194,967 | 166,460 | 188,596 | 228,811 | 278,372 | 303,609 | 331,018 | 368,859 | 399,915 | 382,165 | 324,944 |
| 2004 | 237,414 | 164,317 | 167,904 | 189,798 | 239,977 | 292,270 | 321,543 | 360,608 | 402,195 | 422,329 | 411,381 | 360,036 |
| 2005 | 282,749 | 228,774 | 221,962 | 244,239 | 299,082 | 343,893 | 368,470 | 380,570 | 410,516 | 440,285 | 431,054 | 375,687 |
| 2006 | 331,947 | 270,181 | 235,983 | 263,379 | 320,503 | 362,737 | 378,602 | 406,274 | 449,889 | 469,636 | 457,464 | 391,326 |
| 2007 | 284,588 | 231,072 | 238,575 | 266,902 | 325,701 | 372,551 | 399,873 | 405,168 | 438,192 | 464,597 | 461,634 | 384,300 |
| 2008 | 256,083 | 191,377 | 176,488 | 197,058 | 255,504 | 309,916 | 355,916 | 382,269 | 431,000 | 458,209 | 466,211 | 387,907 |
| 2009 | 331,203 | 287,212 | 278,516 | 313,902 | 379,528 | 426,932 | 435,790 | 456,020 | 490,170 | 516,308 | 524,102 | 432,683 |
| 2010 | 348,178 | 289,525 | 285,910 | 323,453 | 396,133 | 449,428 | 473,201 | 478,471 | 495,090 | 518,737 | 491,413 | 439,065 |
| 2011 | 329,995 | 234,828 | 224,735 | 237,923 | 287,248 | 349,732 | 398,399 | 427,431 | 467,643 | 509,407 | 520,823 | 447,344 |
| 2012 | 394,973 | 356,891 | 353,357 | 379,980 | 428,111 | 476,487 | 500,451 | 496,003 | 522,962 | 559,643 | 558,405 | 503,004 |
| 2013 | 396,177 | 352,171 | 344,117 | 354,321 | 402,739 | 445,109 | 483,147 | 508,347 | 537,246 | 556,867 | 531,428 | 401,553 |
| 2014 | 299,535 | 189,189 | 163,093 | 200,756 | 271,901 | 339,804 | 383,233 | 427,980 | 458,028 | 495,666 | 477,261 | 438,871 |
| - = No Data Reported; -- = Not Applicable; NA = Not Available; W = Withheld to avoid disclosure of individual company data. |
| Release Date: 4/30/2024 |
| Next Release Date: 5/31/2024 |