|
Download Data (XLS File) |
|
|||||
|
|||||
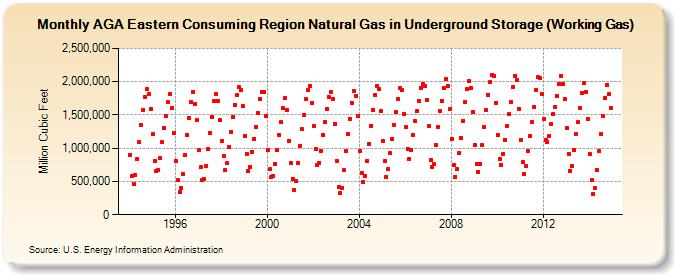
| AGA Eastern Consuming Region Natural Gas in Underground Storage (Working Gas) (Million Cubic Feet) | |||||
| Year | Jan | Feb | Mar | Apr | May | Jun | Jul | Aug | Sep | Oct | Nov | Dec |
|---|---|---|---|---|---|---|---|---|---|---|---|---|
| 1994 | 905,018 | 584,386 | 467,210 | 599,207 | 831,273 | 1,086,355 | 1,342,894 | 1,578,648 | 1,775,994 | 1,885,465 | 1,819,517 | 1,589,500 |
| 1995 | 1,206,116 | 814,626 | 663,885 | 674,424 | 850,290 | 1,085,760 | 1,300,439 | 1,487,188 | 1,690,456 | 1,811,013 | 1,608,177 | 1,232,901 |
| 1996 | 812,303 | 520,053 | 341,177 | 397,770 | 612,572 | 890,243 | 1,192,952 | 1,456,355 | 1,695,873 | 1,838,842 | 1,664,539 | 1,423,793 |
| 1997 | 965,310 | 711,444 | 521,508 | 539,750 | 735,527 | 985,803 | 1,230,970 | 1,474,855 | 1,702,601 | 1,816,709 | 1,706,526 | 1,416,580 |
| 1998 | 1,108,737 | 878,420 | 669,205 | 772,790 | 1,017,260 | 1,248,564 | 1,462,360 | 1,644,247 | 1,797,048 | 1,918,157 | 1,878,225 | 1,630,559 |
| 1999 | 1,179,354 | 916,740 | 659,697 | 722,661 | 942,649 | 1,142,813 | 1,321,137 | 1,526,787 | 1,739,728 | 1,848,455 | 1,846,898 | 1,483,927 |
| 2000 | 978,486 | 690,399 | 568,084 | 582,363 | 764,354 | 966,457 | 1,194,488 | 1,389,270 | 1,599,229 | 1,752,408 | 1,576,088 | 1,105,312 |
| 2001 | 777,686 | 539,354 | 377,372 | 504,253 | 781,266 | 1,038,734 | 1,288,610 | 1,505,744 | 1,734,590 | 1,878,944 | 1,929,902 | 1,672,949 |
| 2002 | 1,331,355 | 981,865 | 746,211 | 783,798 | 961,190 | 1,197,927 | 1,391,036 | 1,583,811 | 1,776,738 | 1,838,184 | 1,733,221 | 1,369,773 |
| 2003 | 812,073 | 416,707 | 329,792 | 409,032 | 668,010 | 954,453 | 1,218,235 | 1,439,632 | 1,686,368 | 1,857,559 | 1,791,464 | 1,487,230 |
| 2004 | 958,171 | 623,321 | 490,182 | 585,035 | 812,597 | 1,070,093 | 1,337,933 | 1,574,654 | 1,793,043 | 1,936,472 | 1,889,522 | 1,552,836 |
| 2005 | 1,104,241 | 802,982 | 569,238 | 685,444 | 921,873 | 1,143,481 | 1,351,071 | 1,540,545 | 1,741,505 | 1,897,133 | 1,870,705 | 1,511,312 |
| 2006 | 1,319,472 | 994,856 | 831,324 | 970,975 | 1,199,479 | 1,404,054 | 1,552,124 | 1,709,486 | 1,903,108 | 1,962,147 | 1,936,153 | 1,726,016 |
| 2007 | 1,328,888 | 825,563 | 717,808 | 759,283 | 1,044,064 | 1,311,742 | 1,552,593 | 1,712,975 | 1,898,374 | 2,032,486 | 1,939,065 | 1,585,977 |
| 2008 | 1,139,112 | 749,235 | 573,655 | 689,885 | 923,897 | 1,156,512 | 1,415,660 | 1,693,252 | 1,887,272 | 2,009,230 | 1,908,994 | 1,551,347 |
| 2009 | 1,048,723 | 764,263 | 643,696 | 768,035 | 1,047,951 | 1,322,001 | 1,580,211 | 1,801,256 | 1,987,872 | 2,096,334 | 2,084,406 | 1,684,346 |
| 2010 | 1,196,864 | 831,706 | 744,579 | 916,926 | 1,129,704 | 1,329,521 | 1,506,667 | 1,701,056 | 1,913,559 | 2,091,524 | 2,018,874 | 1,590,510 |
| 2011 | 1,123,385 | 790,679 | 618,050 | 726,513 | 950,249 | 1,187,213 | 1,393,877 | 1,624,296 | 1,877,503 | 2,064,688 | 2,060,897 | 1,821,533 |
| 2012 | 1,431,954 | 1,127,080 | 1,086,077 | 1,181,428 | 1,365,746 | 1,511,473 | 1,621,791 | 1,787,508 | 1,968,446 | 2,089,681 | 1,969,951 | 1,732,048 |
| 2013 | 1,304,999 | 918,756 | 660,642 | 735,864 | 968,296 | 1,208,087 | 1,392,995 | 1,604,183 | 1,833,499 | 1,975,551 | 1,846,657 | 1,445,085 |
| 2014 | 908,672 | 515,351 | 315,511 | 397,436 | 672,169 | 952,499 | 1,214,149 | 1,487,341 | 1,752,710 | 1,951,369 | 1,814,807 | 1,606,846 |
| - = No Data Reported; -- = Not Applicable; NA = Not Available; W = Withheld to avoid disclosure of individual company data. |
| Release Date: 4/30/2024 |
| Next Release Date: 5/31/2024 |