|
Download Data (XLS File) |
|
|||||
|
|||||
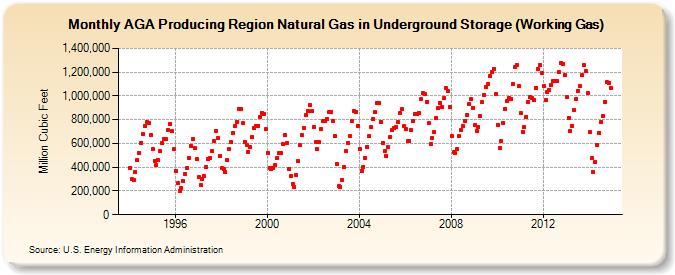
| AGA Producing Region Natural Gas in Underground Storage (Working Gas) (Million Cubic Feet) | |||||
| Year | Jan | Feb | Mar | Apr | May | Jun | Jul | Aug | Sep | Oct | Nov | Dec |
|---|---|---|---|---|---|---|---|---|---|---|---|---|
| 1994 | 393,598 | 297,240 | 289,617 | 356,360 | 461,202 | 516,155 | 604,504 | 678,168 | 747,928 | 783,414 | 775,741 | 673,670 |
| 1995 | 549,759 | 455,591 | 416,294 | 457,969 | 533,496 | 599,582 | 638,359 | 634,297 | 713,319 | 766,411 | 700,456 | 552,458 |
| 1996 | 369,545 | 263,652 | 195,447 | 224,002 | 279,731 | 339,263 | 391,961 | 474,402 | 578,991 | 638,500 | 562,097 | 466,366 |
| 1997 | 314,140 | 248,911 | 297,362 | 326,566 | 401,514 | 471,824 | 478,925 | 532,982 | 617,733 | 705,879 | 642,254 | 494,485 |
| 1998 | 391,395 | 384,696 | 362,717 | 457,545 | 550,232 | 610,363 | 684,086 | 748,042 | 784,567 | 893,181 | 888,358 | 768,239 |
| 1999 | 611,978 | 585,458 | 530,610 | 568,307 | 653,498 | 728,071 | 744,307 | 750,460 | 826,493 | 858,836 | 849,011 | 718,513 |
| 2000 | 521,630 | 394,962 | 380,599 | 393,416 | 420,385 | 477,918 | 515,613 | 520,526 | 591,860 | 667,047 | 603,748 | 382,637 |
| 2001 | 324,922 | 254,522 | 233,826 | 334,065 | 452,428 | 583,340 | 668,757 | 731,916 | 836,028 | 872,858 | 921,406 | 869,867 |
| 2002 | 739,155 | 613,048 | 551,959 | 610,941 | 720,479 | 786,575 | 791,437 | 807,910 | 861,565 | 868,636 | 788,943 | 661,848 |
| 2003 | 428,734 | 238,826 | 233,802 | 295,693 | 400,743 | 532,356 | 604,043 | 665,097 | 790,050 | 872,737 | 864,326 | 750,446 |
| 2004 | 555,459 | 368,119 | 400,325 | 477,622 | 571,186 | 660,572 | 735,092 | 807,351 | 861,312 | 943,435 | 943,643 | 783,203 |
| 2005 | 606,953 | 532,706 | 493,170 | 568,960 | 654,197 | 710,117 | 730,629 | 741,146 | 779,677 | 856,685 | 887,401 | 748,362 |
| 2006 | 719,628 | 621,203 | 624,430 | 710,923 | 789,962 | 849,856 | 848,486 | 853,463 | 970,181 | 1,020,458 | 1,013,035 | 952,614 |
| 2007 | 769,419 | 594,934 | 646,620 | 696,556 | 811,474 | 898,491 | 943,788 | 902,656 | 978,869 | 1,068,297 | 1,041,334 | 908,982 |
| 2008 | 660,687 | 524,079 | 515,923 | 549,459 | 660,142 | 711,120 | 745,447 | 790,642 | 842,646 | 931,942 | 970,706 | 901,110 |
| 2009 | 753,308 | 706,547 | 737,434 | 827,978 | 947,331 | 1,011,199 | 1,074,304 | 1,101,842 | 1,167,935 | 1,197,225 | 1,228,916 | 1,013,046 |
| 2010 | 758,815 | 562,103 | 621,924 | 770,722 | 893,823 | 961,108 | 985,912 | 973,234 | 1,098,996 | 1,240,380 | 1,258,617 | 1,081,510 |
| 2011 | 852,463 | 696,368 | 734,222 | 824,044 | 949,358 | 992,702 | 983,070 | 967,427 | 1,070,553 | 1,229,733 | 1,261,163 | 1,193,143 |
| 2012 | 1,083,080 | 964,839 | 1,033,696 | 1,049,818 | 1,093,203 | 1,127,487 | 1,122,959 | 1,122,624 | 1,201,645 | 1,279,926 | 1,270,859 | 1,177,858 |
| 2013 | 989,094 | 814,514 | 701,343 | 750,674 | 883,251 | 973,266 | 1,043,631 | 1,080,908 | 1,173,305 | 1,262,429 | 1,206,008 | 1,023,435 |
| 2014 | 696,672 | 475,780 | 358,140 | 447,741 | 583,169 | 690,920 | 780,084 | 829,824 | 952,459 | 1,116,521 | 1,110,529 | 1,070,509 |
| - = No Data Reported; -- = Not Applicable; NA = Not Available; W = Withheld to avoid disclosure of individual company data. |
| Release Date: 4/30/2024 |
| Next Release Date: 5/31/2024 |