|
Download Data (XLS File) |
|
|||||
|
|||||
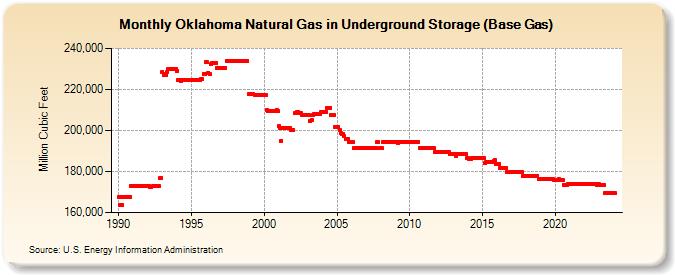
| Oklahoma Natural Gas in Underground Storage (Base Gas) (Million Cubic Feet) | |||||
| Year | Jan | Feb | Mar | Apr | May | Jun | Jul | Aug | Sep | Oct | Nov | Dec |
|---|---|---|---|---|---|---|---|---|---|---|---|---|
| 1990 | 167,385 | 163,458 | 167,385 | 163,458 | 167,385 | 167,385 | 167,385 | 167,385 | 167,385 | 167,385 | 173,097 | 172,762 |
| 1991 | 172,757 | 172,757 | 172,757 | 172,757 | 172,757 | 172,757 | 172,757 | 172,757 | 172,757 | 172,757 | 172,757 | 172,757 |
| 1992 | 172,757 | 172,757 | 172,368 | 172,573 | 172,757 | 172,757 | 172,757 | 172,757 | 172,757 | 172,757 | 176,765 | 176,765 |
| 1993 | 228,593 | 227,252 | 227,560 | 226,942 | 228,574 | 229,750 | 229,765 | 229,765 | 229,765 | 229,765 | 229,765 | 229,765 |
| 1994 | 229,091 | 224,523 | 224,367 | 224,291 | 224,533 | 224,523 | 224,523 | 224,523 | 224,523 | 224,523 | 224,523 | 224,523 |
| 1995 | 224,523 | 224,523 | 224,523 | 224,523 | 224,523 | 224,523 | 224,523 | 224,523 | 225,098 | 225,098 | 227,652 | 227,652 |
| 1996 | 233,217 | 233,217 | 228,125 | 227,331 | 232,250 | 232,667 | 232,660 | 232,651 | 232,647 | 230,509 | 230,504 | 230,500 |
| 1997 | 230,458 | 230,497 | 230,492 | 230,490 | 230,490 | 233,763 | 233,763 | 233,763 | 233,763 | 233,763 | 233,763 | 233,763 |
| 1998 | 233,763 | 233,763 | 233,761 | 233,761 | 233,761 | 233,761 | 234,061 | 234,063 | 234,063 | 234,063 | 234,063 | 217,663 |
| 1999 | 217,663 | 217,663 | 217,663 | 217,663 | 217,527 | 217,527 | 217,527 | 217,527 | 217,527 | 217,527 | 217,527 | 217,527 |
| 2000 | 217,410 | 217,293 | 210,050 | 209,643 | 209,542 | 209,496 | 209,466 | 209,417 | 209,389 | 209,389 | 210,050 | 209,389 |
| 2001 | 202,050 | 201,389 | 195,082 | 200,968 | 200,968 | 200,968 | 200,968 | 200,968 | 200,968 | 200,968 | 200,306 | 200,306 |
| 2002 | 200,306 | 208,376 | 208,376 | 209,037 | 209,037 | 208,376 | 208,376 | 207,488 | 207,408 | 207,408 | 207,408 | 207,488 |
| 2003 | 207,408 | 207,357 | 204,498 | 205,071 | 207,428 | 208,088 | 208,088 | 208,028 | 208,028 | 208,028 | 208,028 | 209,028 |
| 2004 | 209,028 | 209,028 | 209,042 | 209,022 | 211,022 | 211,022 | 211,022 | 207,422 | 207,422 | 207,422 | 201,822 | 201,822 |
| 2005 | 201,822 | 201,822 | 200,075 | 198,808 | 198,208 | 198,208 | 197,208 | 196,054 | 196,054 | 196,054 | 194,308 | 194,308 |
| 2006 | 194,308 | 194,308 | 191,308 | 191,308 | 191,308 | 191,308 | 191,308 | 191,308 | 191,308 | 191,308 | 191,308 | 191,308 |
| 2007 | 191,308 | 191,308 | 191,308 | 191,308 | 191,308 | 191,308 | 191,308 | 191,308 | 191,308 | 194,308 | 194,308 | 191,308 |
| 2008 | 191,308 | 191,308 | 194,261 | 194,308 | 194,308 | 194,308 | 194,308 | 194,308 | 194,308 | 194,308 | 194,308 | 194,308 |
| 2009 | 194,308 | 194,308 | 194,080 | 194,218 | 194,308 | 194,308 | 194,308 | 194,308 | 194,308 | 194,308 | 194,308 | 194,308 |
| 2010 | 194,308 | 194,308 | 194,308 | 194,308 | 194,308 | 194,308 | 194,308 | 194,308 | 191,308 | 191,308 | 191,308 | 191,308 |
| 2011 | 191,308 | 191,308 | 191,308 | 191,308 | 191,308 | 191,308 | 191,308 | 191,308 | 191,308 | 189,308 | 189,308 | 189,308 |
| 2012 | 189,308 | 189,308 | 189,308 | 189,308 | 189,308 | 189,308 | 189,308 | 189,308 | 189,308 | 188,427 | 188,458 | 188,522 |
| 2013 | 188,522 | 188,522 | 187,773 | 188,522 | 188,522 | 188,522 | 188,522 | 188,522 | 188,522 | 188,522 | 188,522 | 186,522 |
| 2014 | 186,522 | 186,063 | 186,310 | 186,522 | 186,522 | 186,522 | 186,522 | 186,522 | 186,522 | 186,522 | 186,522 | 186,522 |
| 2015 | 186,522 | 186,522 | 184,047 | 184,522 | 184,522 | 184,522 | 184,522 | 184,522 | 184,522 | 185,345 | 185,530 | 183,624 |
| 2016 | 183,624 | 183,624 | 181,624 | 181,624 | 181,624 | 181,624 | 181,624 | 181,624 | 179,624 | 179,624 | 179,696 | 179,696 |
| 2017 | 179,696 | 179,696 | 179,696 | 179,696 | 179,696 | 179,696 | 179,696 | 179,696 | 179,696 | 177,696 | 177,696 | 177,696 |
| 2018 | 177,696 | 177,696 | 177,696 | 177,691 | 177,696 | 177,696 | 177,696 | 177,696 | 177,696 | 177,696 | 176,466 | 176,466 |
| 2019 | 176,466 | 176,466 | 176,246 | 176,466 | 176,466 | 176,466 | 176,466 | 176,466 | 176,466 | 176,466 | 176,466 | 175,935 |
| 2020 | 175,935 | 175,935 | 175,935 | 176,154 | 175,935 | 175,935 | 175,935 | 173,595 | 173,595 | 173,672 | 173,795 | 173,795 |
| 2021 | 173,795 | 173,795 | 173,795 | 173,795 | 173,795 | 173,795 | 173,795 | 173,795 | 173,795 | 174,059 | 174,059 | 174,059 |
| 2022 | 174,059 | 174,059 | 174,059 | 174,059 | 174,059 | 173,995 | 173,919 | 173,846 | 173,779 | 173,707 | 173,644 | 173,584 |
| 2023 | 173,707 | 173,651 | 173,593 | 173,544 | 173,499 | 169,499 | 169,499 | 169,499 | 169,499 | 169,387 | 169,387 | 169,387 |
| 2024 | 169,387 | |||||||||||
| - = No Data Reported; -- = Not Applicable; NA = Not Available; W = Withheld to avoid disclosure of individual company data. |
| Release Date: 3/29/2024 |
| Next Release Date: 4/30/2024 |