|
Download Data (XLS File) |
|
|||||
|
|||||
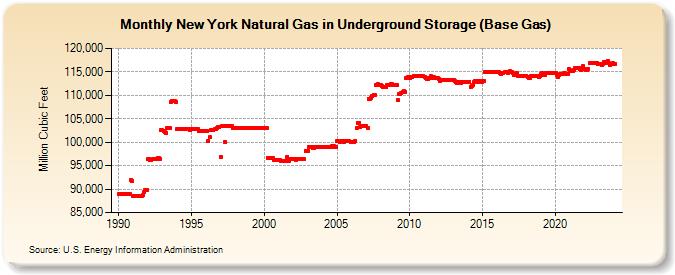
| New York Natural Gas in Underground Storage (Base Gas) (Million Cubic Feet) | |||||
| Year | Jan | Feb | Mar | Apr | May | Jun | Jul | Aug | Sep | Oct | Nov | Dec |
|---|---|---|---|---|---|---|---|---|---|---|---|---|
| 1990 | 88,911 | 88,911 | 88,911 | 88,911 | 88,911 | 88,911 | 88,911 | 88,911 | 88,911 | 88,911 | 91,985 | 91,764 |
| 1991 | 88,494 | 88,494 | 88,494 | 88,494 | 88,494 | 88,494 | 88,494 | 88,494 | 88,794 | 89,294 | 89,794 | 89,789 |
| 1992 | 96,390 | 96,390 | 96,148 | 96,199 | 96,390 | 96,390 | 96,390 | 96,514 | 96,574 | 96,574 | 96,525 | 102,539 |
| 1993 | 102,502 | 102,394 | 102,178 | 102,031 | 102,962 | 102,978 | 102,978 | 108,606 | 108,690 | 108,690 | 108,690 | 108,662 |
| 1994 | 102,808 | 102,808 | 102,808 | 102,808 | 102,808 | 102,808 | 102,808 | 102,808 | 102,808 | 102,808 | 102,808 | 102,663 |
| 1995 | 102,885 | 102,885 | 102,885 | 102,885 | 102,885 | 102,885 | 102,385 | 102,385 | 102,385 | 102,385 | 102,385 | 102,385 |
| 1996 | 102,385 | 102,385 | 100,340 | 101,009 | 102,535 | 102,535 | 102,561 | 102,712 | 102,907 | 103,033 | 103,168 | 103,172 |
| 1997 | 96,919 | 103,424 | 103,540 | 103,540 | 100,093 | 103,540 | 103,540 | 103,540 | 103,540 | 103,540 | 103,095 | 103,095 |
| 1998 | 102,980 | 102,980 | 103,042 | 103,042 | 103,042 | 103,042 | 103,042 | 103,042 | 103,042 | 103,042 | 103,042 | 103,063 |
| 1999 | 103,063 | 103,063 | 103,063 | 103,063 | 103,063 | 103,063 | 103,063 | 103,063 | 103,063 | 103,063 | 103,063 | 103,063 |
| 2000 | 103,063 | 103,063 | 103,063 | 96,737 | 96,737 | 96,737 | 96,737 | 96,583 | 96,214 | 96,195 | 96,198 | 96,172 |
| 2001 | 96,126 | 96,126 | 96,042 | 96,042 | 96,042 | 96,042 | 96,042 | 96,916 | 96,063 | 96,386 | 96,403 | 96,344 |
| 2002 | 96,342 | 96,342 | 96,259 | 96,341 | 96,342 | 96,342 | 96,342 | 96,344 | 96,345 | 96,347 | 98,199 | 98,199 |
| 2003 | 98,199 | 99,027 | 99,026 | 99,026 | 98,856 | 98,856 | 98,957 | 99,013 | 98,937 | 99,037 | 99,004 | 98,908 |
| 2004 | 98,973 | 98,936 | 98,932 | 98,925 | 98,894 | 98,926 | 99,027 | 99,073 | 99,090 | 99,087 | 99,040 | 99,077 |
| 2005 | 100,163 | 100,179 | 100,138 | 100,198 | 100,207 | 100,255 | 100,125 | 100,303 | 100,313 | 100,216 | 100,228 | 100,118 |
| 2006 | 100,048 | 100,099 | 99,956 | 100,237 | 103,002 | 104,133 | 104,166 | 103,193 | 103,394 | 103,494 | 103,442 | 103,410 |
| 2007 | 103,464 | 102,977 | 109,311 | 109,316 | 109,484 | 109,934 | 110,082 | 110,159 | 112,168 | 112,224 | 112,307 | 112,212 |
| 2008 | 112,241 | 112,013 | 111,686 | 111,700 | 111,823 | 112,106 | 112,212 | 112,144 | 112,402 | 112,341 | 112,249 | 112,203 |
| 2009 | 112,173 | 112,117 | 108,953 | 110,292 | 110,370 | 110,554 | 110,719 | 110,815 | 110,744 | 113,698 | 113,808 | 113,730 |
| 2010 | 113,738 | 113,794 | 113,812 | 114,142 | 114,161 | 114,138 | 114,145 | 114,116 | 114,055 | 114,138 | 114,180 | 114,097 |
| 2011 | 113,956 | 113,668 | 113,379 | 113,453 | 113,748 | 114,014 | 113,760 | 113,805 | 113,812 | 113,629 | 113,627 | 113,584 |
| 2012 | 113,470 | 113,085 | 113,160 | 113,176 | 113,183 | 113,314 | 113,268 | 113,187 | 113,239 | 113,169 | 113,171 | 113,216 |
| 2013 | 113,219 | 113,110 | 112,769 | 112,678 | 112,806 | 112,927 | 112,547 | 112,908 | 112,856 | 112,866 | 112,836 | 112,855 |
| 2014 | 112,918 | 112,908 | 111,817 | 112,062 | 112,250 | 112,938 | 113,150 | 113,011 | 112,896 | 113,115 | 113,015 | 112,934 |
| 2015 | 113,028 | 112,944 | 114,933 | 114,863 | 114,889 | 114,898 | 115,064 | 114,874 | 115,037 | 114,966 | 115,001 | 114,992 |
| 2016 | 114,956 | 114,913 | 114,853 | 114,603 | 114,779 | 114,826 | 114,908 | 115,031 | 115,004 | 114,821 | 115,084 | 115,000 |
| 2017 | 114,964 | 114,762 | 114,267 | 114,638 | 114,659 | 114,068 | 114,141 | 114,156 | 114,164 | 114,164 | 114,176 | 114,176 |
| 2018 | 114,176 | 113,925 | 113,718 | 113,678 | 114,115 | 114,176 | 114,176 | 114,176 | 114,176 | 114,145 | 113,954 | 114,176 |
| 2019 | 114,456 | 114,763 | 114,418 | 114,343 | 114,694 | 114,763 | 114,764 | 114,763 | 114,763 | 114,763 | 114,763 | 114,763 |
| 2020 | 114,763 | 114,278 | 113,953 | 114,359 | 114,593 | 114,593 | 114,599 | 114,728 | 114,762 | 114,592 | 114,592 | 115,540 |
| 2021 | 115,385 | 115,087 | 115,122 | 115,372 | 115,779 | 115,849 | 115,871 | 115,829 | 115,712 | 115,375 | 115,721 | 116,147 |
| 2022 | 115,641 | 115,461 | 115,356 | 115,610 | 116,874 | 116,978 | 116,942 | 116,896 | 116,964 | 116,827 | 116,862 | 116,680 |
| 2023 | 116,661 | 116,578 | 116,477 | 116,671 | 117,024 | 116,846 | 117,148 | 117,314 | 116,814 | 116,540 | 116,773 | 116,824 |
| 2024 | 116,728 | 116,766 | ||||||||||
| - = No Data Reported; -- = Not Applicable; NA = Not Available; W = Withheld to avoid disclosure of individual company data. |
| Release Date: 4/30/2024 |
| Next Release Date: 5/31/2024 |