|
Download Data (XLS File) |
|
|||||
|
|||||
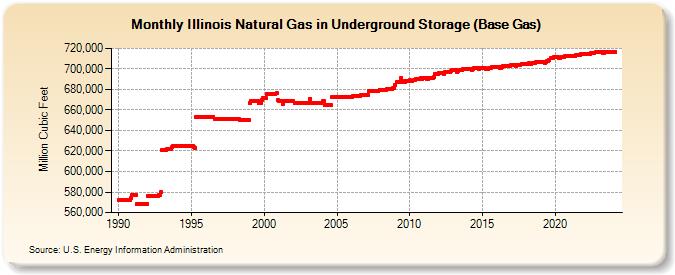
| Illinois Natural Gas in Underground Storage (Base Gas) (Million Cubic Feet) | |||||
| Year | Jan | Feb | Mar | Apr | May | Jun | Jul | Aug | Sep | Oct | Nov | Dec |
|---|---|---|---|---|---|---|---|---|---|---|---|---|
| 1990 | 571,959 | 571,959 | 571,959 | 571,959 | 572,425 | 572,423 | 572,421 | 572,421 | 572,419 | 572,419 | 573,776 | 577,424 |
| 1991 | 577,418 | 577,418 | 577,418 | 568,227 | 568,178 | 568,160 | 568,158 | 568,157 | 568,157 | 568,158 | 568,158 | 568,158 |
| 1992 | 576,257 | 576,227 | 576,227 | 576,227 | 576,227 | 576,227 | 576,227 | 576,234 | 576,234 | 577,202 | 577,202 | 579,715 |
| 1993 | 620,575 | 620,856 | 620,777 | 621,051 | 621,543 | 621,543 | 621,543 | 621,543 | 623,466 | 624,434 | 624,483 | 624,483 |
| 1994 | 624,627 | 624,627 | 624,579 | 624,777 | 624,777 | 624,777 | 624,777 | 624,777 | 624,777 | 624,777 | 624,777 | 625,262 |
| 1995 | 625,262 | 625,262 | 623,587 | 622,897 | 653,428 | 653,428 | 653,428 | 653,428 | 653,428 | 653,428 | 653,428 | 653,428 |
| 1996 | 653,428 | 653,428 | 653,410 | 653,428 | 653,386 | 653,395 | 653,428 | 651,468 | 651,468 | 651,468 | 651,468 | 651,468 |
| 1997 | 651,468 | 651,468 | 651,468 | 651,467 | 651,467 | 651,467 | 651,466 | 651,468 | 651,468 | 651,404 | 651,404 | 651,403 |
| 1998 | 651,403 | 651,403 | 651,403 | 650,968 | 649,897 | 649,967 | 649,897 | 649,968 | 649,968 | 649,968 | 649,968 | 649,968 |
| 1999 | 667,226 | 668,662 | 668,660 | 668,659 | 668,650 | 668,642 | 668,622 | 668,605 | 666,907 | 666,901 | 670,098 | 671,781 |
| 2000 | 671,781 | 671,781 | 675,781 | 675,781 | 675,778 | 675,870 | 675,870 | 675,870 | 675,870 | 675,729 | 676,369 | 669,280 |
| 2001 | 669,070 | 668,981 | 668,481 | 665,721 | 668,481 | 668,481 | 668,482 | 668,482 | 668,482 | 668,482 | 668,482 | 668,482 |
| 2002 | 668,482 | 666,632 | 666,632 | 666,632 | 666,632 | 666,632 | 666,632 | 666,632 | 666,632 | 666,632 | 666,632 | 666,632 |
| 2003 | 666,839 | 666,838 | 670,940 | 666,338 | 666,338 | 666,338 | 666,338 | 666,338 | 666,338 | 666,338 | 666,338 | 666,338 |
| 2004 | 668,478 | 668,478 | 664,585 | 664,585 | 664,474 | 664,474 | 664,474 | 664,474 | 672,320 | 672,320 | 672,320 | 672,320 |
| 2005 | 672,320 | 672,664 | 672,320 | 672,320 | 672,320 | 672,320 | 672,320 | 672,320 | 673,068 | 673,068 | 673,068 | 673,068 |
| 2006 | 673,068 | 673,361 | 673,361 | 673,261 | 673,261 | 673,261 | 673,261 | 673,261 | 674,484 | 674,484 | 674,484 | 674,697 |
| 2007 | 674,697 | 674,697 | 678,329 | 678,329 | 678,329 | 678,329 | 678,329 | 678,329 | 678,329 | 678,329 | 678,329 | 679,607 |
| 2008 | 679,535 | 679,535 | 679,653 | 679,653 | 679,653 | 680,168 | 680,168 | 680,168 | 680,586 | 680,586 | 681,443 | 681,672 |
| 2009 | 684,069 | 687,205 | 687,298 | 686,964 | 687,298 | 691,226 | 687,769 | 687,202 | 687,635 | 688,235 | 688,275 | 688,510 |
| 2010 | 689,076 | 688,550 | 688,631 | 688,879 | 689,068 | 689,709 | 689,709 | 689,709 | 690,137 | 690,920 | 689,937 | 691,023 |
| 2011 | 691,023 | 691,023 | 690,651 | 690,295 | 691,011 | 691,495 | 691,495 | 691,495 | 691,907 | 694,889 | 694,889 | 695,103 |
| 2012 | 696,088 | 696,088 | 696,169 | 695,715 | 695,185 | 696,593 | 696,593 | 696,593 | 696,969 | 696,969 | 698,358 | 698,574 |
| 2013 | 698,574 | 698,574 | 698,650 | 696,834 | 698,262 | 699,144 | 699,144 | 699,144 | 699,536 | 700,017 | 700,050 | 700,184 |
| 2014 | 700,184 | 700,184 | 699,958 | 699,352 | 700,240 | 700,721 | 700,721 | 700,721 | 701,148 | 700,350 | 700,402 | 700,576 |
| 2015 | 700,576 | 700,576 | 700,637 | 700,098 | 699,984 | 701,159 | 701,159 | 701,159 | 701,532 | 701,732 | 701,762 | 701,925 |
| 2016 | 701,925 | 701,925 | 701,214 | 700,778 | 701,417 | 702,443 | 702,443 | 702,443 | 702,905 | 703,105 | 702,985 | 703,379 |
| 2017 | 703,379 | 703,379 | 703,684 | 702,958 | 703,372 | 704,110 | 704,110 | 704,110 | 704,593 | 704,845 | 704,925 | 705,201 |
| 2018 | 705,201 | 705,201 | 705,501 | 704,613 | 704,608 | 705,863 | 705,882 | 705,953 | 706,390 | 706,520 | 706,621 | 706,895 |
| 2019 | 706,895 | 706,895 | 706,375 | 705,678 | 706,365 | 707,450 | 707,450 | 708,550 | 710,151 | 710,931 | 710,981 | 711,150 |
| 2020 | 711,150 | 711,150 | 711,192 | 710,391 | 710,380 | 711,655 | 711,642 | 711,655 | 712,099 | 712,372 | 712,642 | 712,818 |
| 2021 | 712,818 | 712,818 | 712,818 | 712,173 | 712,313 | 713,269 | 713,268 | 713,268 | 713,825 | 714,326 | 714,426 | 714,795 |
| 2022 | 714,795 | 714,795 | 714,216 | 714,795 | 714,274 | 715,252 | 715,252 | 715,252 | 715,792 | 716,020 | 716,070 | 716,418 |
| 2023 | 716,418 | 716,418 | 716,200 | 715,083 | 715,514 | 716,361 | 716,328 | 716,318 | 716,418 | 716,620 | 716,820 | 716,820 |
| 2024 | 716,820 | 716,820 | ||||||||||
| - = No Data Reported; -- = Not Applicable; NA = Not Available; W = Withheld to avoid disclosure of individual company data. |
| Release Date: 4/30/2024 |
| Next Release Date: 5/31/2024 |