|
Download Data (XLS File) |
|
|||||
|
|||||
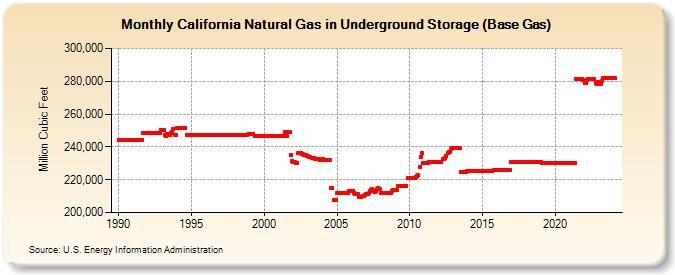
| California Natural Gas in Underground Storage (Base Gas) (Million Cubic Feet) | |||||
| Year | Jan | Feb | Mar | Apr | May | Jun | Jul | Aug | Sep | Oct | Nov | Dec |
|---|---|---|---|---|---|---|---|---|---|---|---|---|
| 1990 | 243,944 | 243,944 | 243,944 | 243,944 | 243,944 | 243,944 | 243,944 | 243,944 | 243,944 | 243,944 | 243,944 | 243,944 |
| 1991 | 243,944 | 243,944 | 243,944 | 243,944 | 243,944 | 243,944 | 243,944 | 243,944 | 248,389 | 248,389 | 248,389 | 248,389 |
| 1992 | 248,389 | 248,389 | 248,389 | 248,389 | 248,389 | 248,389 | 248,389 | 248,389 | 248,389 | 248,389 | 248,389 | 250,206 |
| 1993 | 250,206 | 250,206 | 247,228 | 246,345 | 247,699 | 247,950 | 247,109 | 248,215 | 248,944 | 251,050 | 247,420 | 247,425 |
| 1994 | 251,384 | 251,384 | 251,384 | 251,384 | 251,384 | 251,384 | 251,384 | 251,384 | 247,435 | 247,435 | 247,435 | 247,435 |
| 1995 | 247,419 | 247,419 | 247,419 | 247,419 | 247,419 | 247,419 | 247,419 | 247,419 | 247,419 | 247,419 | 247,419 | 247,419 |
| 1996 | 247,419 | 247,419 | 247,419 | 247,419 | 247,419 | 247,419 | 247,419 | 247,419 | 247,419 | 247,419 | 247,419 | 247,419 |
| 1997 | 247,419 | 247,419 | 247,419 | 247,419 | 247,419 | 247,419 | 247,419 | 247,419 | 247,414 | 247,419 | 247,401 | 247,394 |
| 1998 | 247,389 | 247,389 | 247,383 | 247,383 | 247,361 | 247,309 | 247,266 | 247,224 | 247,226 | 247,188 | 247,156 | 248,033 |
| 1999 | 248,002 | 247,982 | 247,961 | 247,942 | 246,825 | 246,825 | 246,825 | 246,825 | 246,825 | 246,825 | 246,825 | 246,825 |
| 2000 | 246,825 | 246,825 | 246,825 | 246,825 | 246,825 | 246,825 | 246,825 | 246,825 | 246,825 | 246,825 | 246,825 | 246,825 |
| 2001 | 246,825 | 246,825 | 246,825 | 246,825 | 246,825 | 249,325 | 249,325 | 246,621 | 249,325 | 249,225 | 235,225 | 231,467 |
| 2002 | 230,993 | 230,666 | 230,207 | 229,895 | 236,523 | 236,466 | 236,125 | 235,462 | 235,445 | 235,104 | 234,793 | 234,499 |
| 2003 | 234,213 | 233,927 | 233,693 | 233,462 | 233,235 | 233,033 | 232,833 | 232,652 | 232,490 | 232,331 | 232,173 | 232,013 |
| 2004 | 232,409 | 232,271 | 232,134 | 232,005 | 231,884 | 231,786 | 231,737 | 214,829 | 214,829 | 207,829 | 207,829 | 207,829 |
| 2005 | 211,829 | 211,829 | 211,829 | 211,829 | 211,829 | 211,829 | 211,829 | 211,829 | 211,829 | 211,829 | 213,419 | 213,419 |
| 2006 | 213,419 | 213,419 | 211,669 | 211,419 | 211,419 | 211,419 | 209,441 | 209,552 | 209,752 | 209,959 | 210,246 | 210,771 |
| 2007 | 211,210 | 211,125 | 211,791 | 212,924 | 213,696 | 214,088 | 213,073 | 212,652 | 213,305 | 214,348 | 215,179 | 214,219 |
| 2008 | 211,913 | 211,913 | 211,913 | 211,913 | 211,913 | 211,913 | 211,913 | 211,913 | 211,913 | 213,118 | 213,913 | 213,913 |
| 2009 | 213,913 | 213,913 | 216,413 | 216,413 | 216,413 | 216,413 | 216,413 | 216,413 | 216,413 | 216,413 | 221,002 | 221,002 |
| 2010 | 221,002 | 221,002 | 221,002 | 221,082 | 221,324 | 221,769 | 222,446 | 222,735 | 228,047 | 233,909 | 236,285 | 230,285 |
| 2011 | 230,285 | 230,285 | 230,285 | 230,285 | 230,672 | 230,672 | 230,672 | 230,672 | 230,672 | 230,672 | 230,672 | 230,972 |
| 2012 | 230,972 | 230,972 | 230,972 | 232,362 | 232,362 | 232,975 | 234,683 | 236,412 | 236,913 | 236,923 | 238,933 | 239,233 |
| 2013 | 239,233 | 239,233 | 239,233 | 239,233 | 239,233 | 239,233 | 224,948 | 224,948 | 224,948 | 224,948 | 224,948 | 225,250 |
| 2014 | 225,250 | 225,250 | 225,250 | 225,250 | 225,250 | 225,250 | 225,250 | 225,250 | 225,250 | 225,550 | 225,550 | 225,550 |
| 2015 | 225,550 | 225,550 | 225,550 | 225,550 | 225,550 | 225,550 | 225,550 | 225,550 | 225,550 | 225,845 | 225,845 | 225,845 |
| 2016 | 225,845 | 225,845 | 225,845 | 225,845 | 225,845 | 225,845 | 225,845 | 225,845 | 225,845 | 225,845 | 225,845 | 230,605 |
| 2017 | 230,605 | 230,605 | 230,605 | 230,605 | 230,605 | 230,605 | 230,605 | 230,605 | 230,605 | 230,605 | 230,605 | 230,605 |
| 2018 | 230,605 | 230,605 | 230,605 | 230,605 | 230,605 | 230,605 | 230,605 | 230,605 | 230,605 | 230,605 | 230,605 | 230,605 |
| 2019 | 230,605 | 230,115 | 230,115 | 230,115 | 230,115 | 230,115 | 230,115 | 230,115 | 230,115 | 230,115 | 230,115 | 230,115 |
| 2020 | 230,115 | 230,115 | 230,115 | 230,115 | 230,115 | 230,115 | 230,115 | 230,115 | 230,115 | 230,115 | 230,115 | 230,115 |
| 2021 | 230,115 | 230,115 | 230,115 | 230,115 | 230,115 | 281,213 | 281,213 | 281,213 | 281,213 | 281,213 | 281,213 | 280,921 |
| 2022 | 279,035 | 278,849 | 280,762 | 281,213 | 281,213 | 281,213 | 281,213 | 281,182 | 281,213 | 278,939 | 278,514 | 279,713 |
| 2023 | 279,355 | 278,461 | 279,911 | 281,703 | 281,703 | 281,703 | 281,703 | 281,703 | 281,703 | 281,703 | 281,703 | 281,703 |
| 2024 | 281,703 | 281,703 | ||||||||||
| - = No Data Reported; -- = Not Applicable; NA = Not Available; W = Withheld to avoid disclosure of individual company data. |
| Release Date: 4/30/2024 |
| Next Release Date: 5/31/2024 |