|
Download Data (XLS File) |
|
|||||
|
|||||
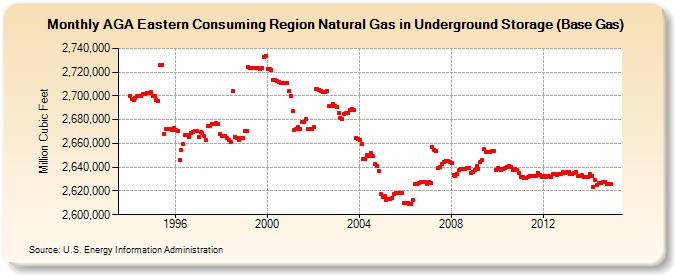
| AGA Eastern Consuming Region Natural Gas in Underground Storage (Base Gas) (Million Cubic Feet) | |||||
| Year | Jan | Feb | Mar | Apr | May | Jun | Jul | Aug | Sep | Oct | Nov | Dec |
|---|---|---|---|---|---|---|---|---|---|---|---|---|
| 1994 | 2,700,245 | 2,697,308 | 2,696,823 | 2,698,489 | 2,699,802 | 2,699,840 | 2,700,331 | 2,701,227 | 2,701,285 | 2,702,703 | 2,702,571 | 2,703,149 |
| 1995 | 2,699,674 | 2,699,575 | 2,696,880 | 2,695,400 | 2,726,268 | 2,726,255 | 2,668,312 | 2,671,818 | 2,672,399 | 2,672,258 | 2,671,362 | 2,672,808 |
| 1996 | 2,670,906 | 2,670,070 | 2,646,056 | 2,654,836 | 2,659,533 | 2,667,092 | 2,667,020 | 2,665,705 | 2,668,975 | 2,669,980 | 2,670,274 | 2,670,239 |
| 1997 | 2,665,398 | 2,669,603 | 2,668,763 | 2,665,910 | 2,662,796 | 2,675,047 | 2,675,015 | 2,676,601 | 2,676,773 | 2,677,093 | 2,676,542 | 2,667,760 |
| 1998 | 2,666,003 | 2,666,279 | 2,666,299 | 2,664,193 | 2,663,159 | 2,660,954 | 2,703,770 | 2,665,205 | 2,664,714 | 2,662,805 | 2,664,518 | 2,664,462 |
| 1999 | 2,670,291 | 2,670,052 | 2,724,632 | 2,723,306 | 2,723,541 | 2,723,524 | 2,723,432 | 2,723,441 | 2,722,786 | 2,723,134 | 2,733,005 | 2,733,627 |
| 2000 | 2,723,071 | 2,722,288 | 2,721,943 | 2,713,533 | 2,713,418 | 2,712,422 | 2,711,852 | 2,711,174 | 2,710,974 | 2,710,588 | 2,711,035 | 2,703,944 |
| 2001 | 2,700,251 | 2,687,027 | 2,671,709 | 2,672,287 | 2,674,041 | 2,672,286 | 2,678,137 | 2,678,287 | 2,680,205 | 2,672,338 | 2,672,185 | 2,671,878 |
| 2002 | 2,673,629 | 2,705,775 | 2,705,432 | 2,705,197 | 2,704,313 | 2,703,389 | 2,703,568 | 2,703,851 | 2,691,493 | 2,691,448 | 2,693,253 | 2,691,726 |
| 2003 | 2,690,745 | 2,685,905 | 2,681,121 | 2,680,304 | 2,685,188 | 2,685,571 | 2,685,437 | 2,688,127 | 2,689,105 | 2,687,841 | 2,664,279 | 2,663,587 |
| 2004 | 2,662,938 | 2,659,235 | 2,647,171 | 2,647,239 | 2,649,970 | 2,649,115 | 2,652,125 | 2,649,119 | 2,642,400 | 2,640,979 | 2,636,896 | 2,617,238 |
| 2005 | 2,615,241 | 2,615,470 | 2,612,179 | 2,612,927 | 2,613,203 | 2,614,234 | 2,617,123 | 2,618,103 | 2,618,523 | 2,618,421 | 2,618,513 | 2,609,685 |
| 2006 | 2,610,257 | 2,610,178 | 2,608,800 | 2,609,265 | 2,612,092 | 2,625,844 | 2,625,997 | 2,626,311 | 2,627,538 | 2,627,643 | 2,627,591 | 2,625,547 |
| 2007 | 2,627,149 | 2,626,694 | 2,656,832 | 2,654,292 | 2,653,213 | 2,639,448 | 2,639,884 | 2,642,274 | 2,644,500 | 2,645,256 | 2,645,482 | 2,644,787 |
| 2008 | 2,643,354 | 2,633,773 | 2,632,551 | 2,633,942 | 2,637,297 | 2,638,747 | 2,638,534 | 2,638,355 | 2,639,018 | 2,639,073 | 2,635,124 | 2,636,001 |
| 2009 | 2,637,974 | 2,640,888 | 2,638,581 | 2,644,333 | 2,646,061 | 2,654,967 | 2,653,107 | 2,652,639 | 2,653,076 | 2,653,384 | 2,653,534 | 2,637,912 |
| 2010 | 2,638,914 | 2,638,781 | 2,637,333 | 2,638,437 | 2,639,692 | 2,640,524 | 2,640,586 | 2,640,317 | 2,637,766 | 2,638,696 | 2,637,747 | 2,635,530 |
| 2011 | 2,632,155 | 2,631,824 | 2,630,986 | 2,630,664 | 2,631,832 | 2,632,742 | 2,632,497 | 2,632,542 | 2,632,962 | 2,635,460 | 2,633,461 | 2,631,633 |
| 2012 | 2,632,507 | 2,632,124 | 2,632,282 | 2,632,372 | 2,632,109 | 2,633,924 | 2,633,877 | 2,633,803 | 2,634,234 | 2,634,167 | 2,635,560 | 2,634,696 |
| 2013 | 2,635,814 | 2,635,709 | 2,634,523 | 2,633,879 | 2,635,442 | 2,636,357 | 2,632,322 | 2,632,734 | 2,633,097 | 2,631,422 | 2,631,427 | 2,632,077 |
| 2014 | 2,633,924 | 2,632,973 | 2,623,704 | 2,629,330 | 2,625,041 | 2,626,796 | 2,627,055 | 2,627,251 | 2,627,453 | 2,625,581 | 2,625,620 | 2,625,561 |
| - = No Data Reported; -- = Not Applicable; NA = Not Available; W = Withheld to avoid disclosure of individual company data. |
| Release Date: 4/30/2024 |
| Next Release Date: 5/31/2024 |