|
Download Data (XLS File) |
|
|||||
|
|||||
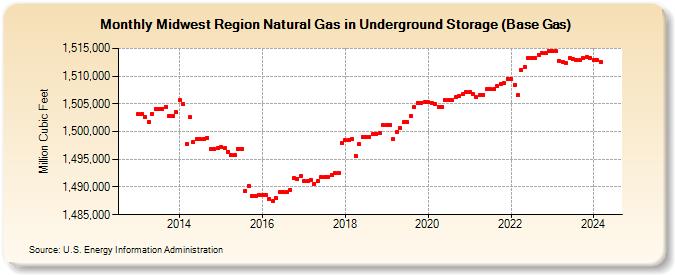
| Midwest Region Natural Gas in Underground Storage (Base Gas) (Million Cubic Feet) | |||||
| Year | Jan | Feb | Mar | Apr | May | Jun | Jul | Aug | Sep | Oct | Nov | Dec |
|---|---|---|---|---|---|---|---|---|---|---|---|---|
| 2013 | 1,503,197 | 1,503,193 | 1,502,629 | 1,501,810 | 1,503,236 | 1,504,117 | 1,504,116 | 1,504,114 | 1,504,506 | 1,502,817 | 1,502,848 | 1,503,480 |
| 2014 | 1,505,645 | 1,504,979 | 1,497,798 | 1,502,556 | 1,498,128 | 1,498,610 | 1,498,610 | 1,498,610 | 1,498,887 | 1,496,791 | 1,496,848 | 1,497,021 |
| 2015 | 1,497,256 | 1,496,957 | 1,496,400 | 1,495,858 | 1,495,743 | 1,496,917 | 1,496,915 | 1,489,324 | 1,490,195 | 1,488,404 | 1,488,432 | 1,488,593 |
| 2016 | 1,488,560 | 1,488,552 | 1,487,836 | 1,487,397 | 1,488,033 | 1,489,057 | 1,489,056 | 1,489,055 | 1,489,512 | 1,491,616 | 1,491,519 | 1,491,910 |
| 2017 | 1,491,050 | 1,491,049 | 1,491,350 | 1,490,622 | 1,491,038 | 1,491,775 | 1,491,774 | 1,491,759 | 1,492,240 | 1,492,505 | 1,492,582 | 1,497,913 |
| 2018 | 1,498,409 | 1,498,408 | 1,498,706 | 1,495,666 | 1,497,726 | 1,498,979 | 1,498,997 | 1,499,068 | 1,499,504 | 1,499,617 | 1,499,715 | 1,501,173 |
| 2019 | 1,501,161 | 1,501,157 | 1,498,647 | 1,499,934 | 1,500,618 | 1,501,700 | 1,501,697 | 1,502,795 | 1,504,393 | 1,505,171 | 1,505,220 | 1,505,244 |
| 2020 | 1,505,242 | 1,505,240 | 1,505,049 | 1,504,476 | 1,504,463 | 1,505,735 | 1,505,721 | 1,505,731 | 1,506,172 | 1,506,443 | 1,506,711 | 1,507,166 |
| 2021 | 1,507,164 | 1,506,693 | 1,506,176 | 1,506,507 | 1,506,649 | 1,507,602 | 1,507,599 | 1,507,597 | 1,508,152 | 1,508,650 | 1,508,747 | 1,509,459 |
| 2022 | 1,509,457 | 1,508,372 | 1,506,522 | 1,511,118 | 1,511,692 | 1,513,319 | 1,513,317 | 1,513,315 | 1,513,853 | 1,514,079 | 1,514,127 | 1,514,512 |
| 2023 | 1,514,512 | 1,514,508 | 1,512,813 | 1,512,619 | 1,512,326 | 1,513,246 | 1,513,082 | 1,512,940 | 1,512,870 | 1,513,224 | 1,513,422 | 1,513,296 |
| 2024 | 1,512,859 | 1,512,854 | ||||||||||
| - = No Data Reported; -- = Not Applicable; NA = Not Available; W = Withheld to avoid disclosure of individual company data. |
| Release Date: 4/30/2024 |
| Next Release Date: 5/31/2024 |