|
Download Data (XLS File) |
|
||||||||
|
||||||||
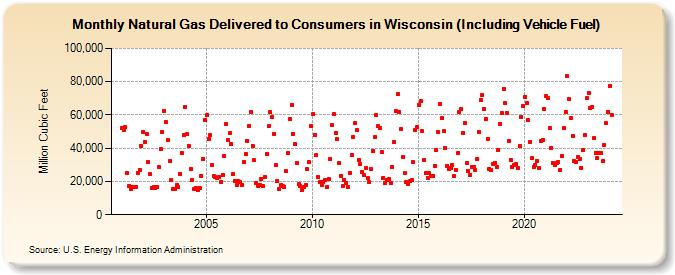
| Natural Gas Delivered to Consumers in Wisconsin (Including Vehicle Fuel) (Million Cubic Feet) | ||||||||
| Year | Jan | Feb | Mar | Apr | May | Jun | Jul | Aug | Sep | Oct | Nov | Dec |
|---|---|---|---|---|---|---|---|---|---|---|---|---|
| 2001 | 52,126 | 51,020 | 52,466 | 24,969 | 17,238 | 15,421 | 16,478 | 16,540 | 16,716 | 25,355 | 26,981 | 41,400 |
| 2002 | 49,850 | 43,815 | 48,646 | 31,946 | 24,278 | 16,100 | 16,531 | 15,795 | 16,659 | 28,429 | 39,330 | 49,912 |
| 2003 | 62,523 | 55,695 | 44,756 | 32,270 | 20,752 | 15,502 | 15,630 | 18,099 | 16,485 | 24,636 | 36,907 | 47,677 |
| 2004 | 65,038 | 48,498 | 41,599 | 27,544 | 21,106 | 15,420 | 15,949 | 14,951 | 16,063 | 23,268 | 33,602 | 56,693 |
| 2005 | 59,667 | 45,463 | 47,647 | 29,885 | 23,265 | 22,788 | 21,959 | 22,549 | 19,566 | 23,868 | 35,232 | 54,600 |
| 2006 | 44,700 | 49,036 | 42,628 | 24,331 | 20,527 | 17,607 | 20,221 | 19,919 | 18,038 | 31,566 | 36,227 | 44,483 |
| 2007 | 53,637 | 61,738 | 41,274 | 32,627 | 19,348 | 17,305 | 18,156 | 21,627 | 17,044 | 22,827 | 36,770 | 53,091 |
| 2008 | 61,668 | 58,488 | 48,757 | 29,799 | 20,131 | 15,599 | 17,839 | 17,219 | 16,667 | 26,065 | 37,029 | 57,404 |
| 2009 | 66,114 | 48,786 | 42,277 | 30,979 | 18,312 | 17,136 | 14,880 | 16,740 | 18,071 | 27,433 | 31,401 | 53,223 |
| 2010 | 60,332 | 48,051 | 35,855 | 22,543 | 19,420 | 17,786 | 19,767 | 20,798 | 16,423 | 21,523 | 33,652 | 53,775 |
| 2011 | 60,332 | 49,272 | 45,294 | 31,132 | 23,558 | 17,038 | 20,921 | 19,016 | 16,907 | 25,197 | 35,686 | 46,774 |
| 2012 | 55,242 | 51,040 | 32,971 | 30,787 | 25,531 | 23,595 | 28,369 | 21,819 | 19,404 | 27,357 | 38,284 | 46,476 |
| 2013 | 59,886 | 53,198 | 51,861 | 37,485 | 22,360 | 18,817 | 20,899 | 21,276 | 19,183 | 28,766 | 43,610 | 62,401 |
| 2014 | 72,528 | 61,885 | 51,669 | 34,699 | 24,789 | 19,528 | 18,700 | 20,077 | 20,584 | 31,769 | 50,744 | 52,517 |
| 2015 | 66,135 | 68,372 | 50,434 | 33,066 | 24,965 | 22,226 | 24,913 | 23,143 | 23,459 | 29,255 | 38,829 | 49,559 |
| 2016 | 66,696 | 57,895 | 50,110 | 40,041 | 29,547 | 27,199 | 28,226 | 29,775 | 23,371 | 26,981 | 36,869 | 61,918 |
| 2017 | 63,301 | 48,942 | 54,904 | 31,261 | 26,153 | 23,977 | 28,388 | 28,474 | 26,745 | 33,773 | 49,484 | 68,747 |
| 2018 | 71,988 | 63,856 | 57,435 | 45,807 | 27,727 | 26,767 | 30,519 | 31,301 | 28,699 | 39,209 | 54,672 | 61,118 |
| 2019 | 75,871 | 67,093 | 61,313 | 44,518 | 33,134 | 28,834 | 30,147 | 30,287 | 28,122 | 41,168 | 58,842 | 65,172 |
| 2020 | 70,936 | 67,236 | 56,657 | 43,721 | 33,910 | 28,928 | 29,901 | 32,236 | 27,808 | 44,147 | 44,986 | 63,557 |
| 2021 | 71,111 | 70,121 | 52,002 | 40,103 | 31,273 | 30,171 | 30,903 | 31,630 | 27,180 | 35,181 | 52,006 | 61,571 |
| 2022 | 83,234 | 69,344 | 57,972 | 47,592 | 32,403 | 31,931 | 34,839 | 33,427 | 28,274 | 38,622 | 48,027 | 69,976 |
| 2023 | 73,323 | 64,408 | 64,617 | 46,027 | 37,321 | 34,046 | 36,868 | 37,178 | 31,812 | 41,935 | 55,184 | 61,698 |
| 2024 | 77,466 | |||||||||||
| - = No Data Reported; -- = Not Applicable; NA = Not Available; W = Withheld to avoid disclosure of individual company data. |
| Release Date: 3/29/2024 |
| Next Release Date: 4/30/2024 |