|
Download Data (XLS File) |
|
||||||||
|
||||||||
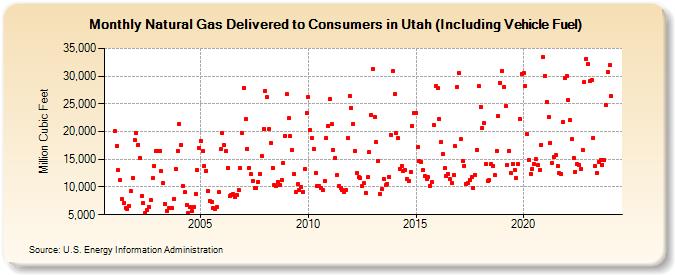
| Natural Gas Delivered to Consumers in Utah (Including Vehicle Fuel) (Million Cubic Feet) | ||||||||
| Year | Jan | Feb | Mar | Apr | May | Jun | Jul | Aug | Sep | Oct | Nov | Dec |
|---|---|---|---|---|---|---|---|---|---|---|---|---|
| 2001 | 20,043 | 17,426 | 13,012 | 11,173 | 7,791 | 7,056 | 6,214 | 6,023 | 6,572 | 9,189 | 11,646 | 18,505 |
| 2002 | 19,727 | 17,659 | 15,165 | 8,453 | 7,113 | 5,260 | 5,915 | 6,481 | 7,591 | 11,589 | 13,814 | 16,447 |
| 2003 | 16,474 | 16,494 | 12,825 | 10,664 | 6,942 | 5,612 | 6,174 | 6,166 | 6,229 | 7,898 | 13,299 | 16,533 |
| 2004 | 21,414 | 17,627 | 10,247 | 9,033 | 6,775 | 5,344 | 6,398 | 5,617 | 6,456 | 8,714 | 13,097 | 17,058 |
| 2005 | 18,357 | 16,430 | 13,763 | 12,951 | 9,253 | 7,461 | 7,380 | 6,187 | 6,053 | 6,449 | 9,027 | 16,786 |
| 2006 | 19,708 | 17,533 | 16,428 | 13,496 | 8,309 | 8,516 | 8,734 | 8,180 | 8,599 | 9,422 | 13,464 | 19,710 |
| 2007 | 27,918 | 22,251 | 16,927 | 13,476 | 12,260 | 11,106 | 9,771 | 9,790 | 10,976 | 12,425 | 15,630 | 20,497 |
| 2008 | 27,371 | 26,146 | 20,495 | 17,995 | 13,506 | 10,286 | 10,157 | 10,919 | 10,422 | 11,249 | 14,386 | 19,141 |
| 2009 | 26,699 | 22,373 | 19,132 | 16,680 | 12,319 | 9,182 | 10,508 | 9,434 | 9,954 | 9,182 | 13,215 | 23,360 |
| 2010 | 26,221 | 20,226 | 18,894 | 16,855 | 12,536 | 10,218 | 10,126 | 9,782 | 9,377 | 11,076 | 18,850 | 21,067 |
| 2011 | 25,869 | 21,300 | 16,688 | 15,267 | 12,191 | 10,213 | 9,820 | 9,452 | 9,037 | 9,505 | 18,781 | 26,458 |
| 2012 | 24,284 | 21,364 | 16,575 | 12,542 | 11,730 | 11,657 | 10,119 | 10,667 | 8,972 | 11,733 | 16,250 | 23,047 |
| 2013 | 31,301 | 22,653 | 18,114 | 14,734 | 8,757 | 9,597 | 11,503 | 10,318 | 10,589 | 11,869 | 19,342 | 30,906 |
| 2014 | 26,709 | 19,728 | 18,758 | 13,307 | 13,793 | 12,880 | 13,073 | 11,473 | 11,124 | 12,741 | 21,030 | 23,363 |
| 2015 | 23,346 | 17,202 | 14,704 | 14,525 | 13,020 | 11,926 | 11,431 | 11,740 | 10,247 | 10,838 | 21,114 | 28,205 |
| 2016 | 27,844 | 22,264 | 18,125 | 15,995 | 13,340 | 11,910 | 12,399 | 11,357 | 10,750 | 12,131 | 17,339 | 28,096 |
| 2017 | 30,551 | 18,583 | 14,758 | 13,865 | 10,620 | 10,729 | 11,208 | 11,786 | 9,864 | 12,247 | 16,754 | 28,190 |
| 2018 | 24,454 | 20,645 | 21,461 | 14,110 | 11,100 | 11,186 | 14,113 | 13,819 | 12,102 | 16,568 | 22,840 | 28,828 |
| 2019 | 30,972 | 28,038 | 24,540 | 14,021 | 16,490 | 12,448 | 14,174 | 13,089 | 11,689 | 14,130 | 22,297 | 30,441 |
| 2020 | 30,604 | 28,183 | 19,470 | 14,887 | 12,410 | 13,323 | 14,150 | 14,984 | 13,888 | 13,068 | 17,620 | 33,438 |
| 2021 | 30,051 | 25,411 | 22,603 | 18,008 | 14,290 | 15,490 | 15,724 | 13,794 | 12,499 | 12,408 | 21,646 | 29,667 |
| 2022 | 30,060 | 25,656 | 22,022 | 18,641 | 15,284 | 12,787 | 14,101 | 14,014 | 13,266 | 16,698 | 28,904 | 33,127 |
| 2023 | 32,216 | 29,088 | 29,213 | 18,906 | 13,705 | 12,551 | 14,557 | 14,856 | 14,016 | 14,884 | 24,738 | 30,700 |
| 2024 | 32,022 | |||||||||||
| - = No Data Reported; -- = Not Applicable; NA = Not Available; W = Withheld to avoid disclosure of individual company data. |
| Release Date: 3/29/2024 |
| Next Release Date: 4/30/2024 |