|
Download Data (XLS File) |
|
||||||||
|
||||||||
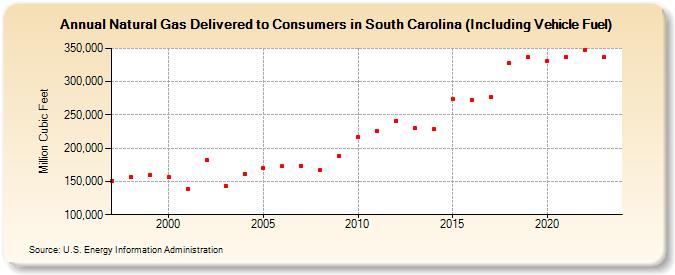
| Natural Gas Delivered to Consumers in South Carolina (Including Vehicle Fuel) (Million Cubic Feet) | ||||||||
| Decade | Year-0 | Year-1 | Year-2 | Year-3 | Year-4 | Year-5 | Year-6 | Year-7 | Year-8 | Year-9 |
|---|---|---|---|---|---|---|---|---|---|---|
| 1990's | 150,978 | 156,295 | 159,338 | |||||||
| 2000's | 156,975 | 138,866 | 181,648 | 143,833 | 161,283 | 169,605 | 172,514 | 173,092 | 167,473 | 188,081 |
| 2010's | 216,783 | 226,089 | 241,434 | 229,768 | 228,116 | 273,217 | 273,172 | 276,582 | 327,664 | 336,564 |
| 2020's | 331,134 | 336,876 | 348,327 | 336,572 |
| - = No Data Reported; -- = Not Applicable; NA = Not Available; W = Withheld to avoid disclosure of individual company data. |
| Release Date: 8/30/2024 |
| Next Release Date: 9/30/2024 |