|
Download Data (XLS File) |
|
||||||||
|
||||||||
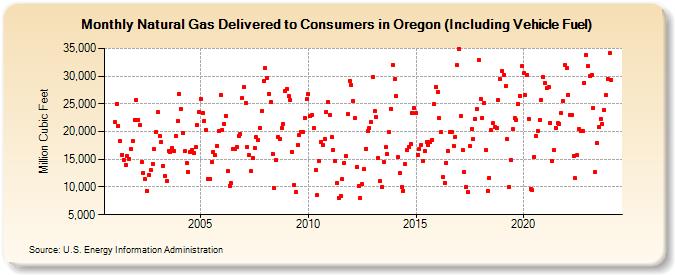
| Natural Gas Delivered to Consumers in Oregon (Including Vehicle Fuel) (Million Cubic Feet) | ||||||||
| Year | Jan | Feb | Mar | Apr | May | Jun | Jul | Aug | Sep | Oct | Nov | Dec |
|---|---|---|---|---|---|---|---|---|---|---|---|---|
| 2001 | 21,689 | 25,019 | 21,080 | 18,224 | 15,822 | 14,891 | 14,036 | 15,541 | 15,102 | 16,822 | 18,239 | 22,097 |
| 2002 | 25,687 | 22,100 | 21,179 | 14,501 | 12,612 | 11,363 | 9,336 | 12,198 | 12,978 | 14,195 | 16,780 | 20,005 |
| 2003 | 23,496 | 19,260 | 18,102 | 13,784 | 12,066 | 11,146 | 16,560 | 16,275 | 17,015 | 16,463 | 19,222 | 21,940 |
| 2004 | 26,773 | 24,112 | 19,699 | 16,486 | 14,346 | 12,752 | 16,235 | 16,733 | 16,179 | 17,146 | 21,137 | 23,569 |
| 2005 | 25,874 | 23,392 | 21,951 | 20,274 | 11,452 | 11,481 | 14,502 | 16,348 | 15,706 | 17,387 | 20,042 | 26,669 |
| 2006 | 20,318 | 21,431 | 22,860 | 12,842 | 10,230 | 10,669 | 16,913 | 16,894 | 17,231 | 19,209 | 19,557 | 26,011 |
| 2007 | 28,069 | 25,150 | 17,200 | 15,707 | 12,870 | 15,191 | 17,040 | 18,957 | 18,499 | 20,671 | 23,789 | 29,061 |
| 2008 | 31,447 | 29,671 | 26,821 | 25,260 | 16,022 | 9,803 | 14,858 | 19,043 | 18,646 | 20,645 | 21,364 | 27,338 |
| 2009 | 27,741 | 26,410 | 25,659 | 16,364 | 10,388 | 9,059 | 17,567 | 19,379 | 19,836 | 19,883 | 22,512 | 25,789 |
| 2010 | 26,794 | 22,751 | 23,026 | 20,642 | 13,041 | 8,528 | 14,662 | 18,188 | 17,657 | 18,664 | 23,575 | 25,371 |
| 2011 | 23,013 | 19,034 | 16,739 | 14,775 | 10,703 | 8,026 | 8,381 | 11,408 | 14,355 | 15,674 | 23,101 | 29,126 |
| 2012 | 28,368 | 25,487 | 22,397 | 13,639 | 10,150 | 8,018 | 10,523 | 13,249 | 16,905 | 20,011 | 20,722 | 21,766 |
| 2013 | 29,905 | 23,631 | 22,597 | 15,302 | 11,066 | 10,007 | 14,566 | 17,134 | 15,968 | 19,865 | 24,143 | 32,092 |
| 2014 | 29,393 | 26,368 | 15,385 | 12,453 | 9,968 | 9,336 | 14,062 | 16,713 | 17,293 | 17,787 | 23,359 | 24,230 |
| 2015 | 23,345 | 15,831 | 16,876 | 17,588 | 14,732 | 16,432 | 18,144 | 17,525 | 18,115 | 18,501 | 24,915 | 28,028 |
| 2016 | 27,145 | 22,433 | 19,837 | 11,726 | 10,777 | 14,403 | 16,533 | 19,872 | 19,838 | 17,451 | 19,098 | 31,942 |
| 2017 | 34,946 | 22,734 | 16,640 | 12,688 | 10,013 | 9,090 | 17,357 | 20,483 | 18,674 | 22,277 | 24,091 | 32,882 |
| 2018 | 25,827 | 22,527 | 25,195 | 16,733 | 9,239 | 11,670 | 20,221 | 21,463 | 20,732 | 20,589 | 25,699 | 29,430 |
| 2019 | 30,896 | 30,196 | 28,234 | 18,615 | 9,975 | 14,852 | 20,450 | 22,479 | 22,172 | 25,026 | 26,490 | 31,774 |
| 2020 | 30,506 | 26,602 | 30,223 | 22,279 | 9,702 | 9,444 | 15,499 | 19,168 | 20,146 | 22,150 | 25,723 | 29,815 |
| 2021 | 28,677 | 27,805 | 28,002 | 21,614 | 14,704 | 16,672 | 20,683 | 21,458 | 21,407 | 23,317 | 25,555 | 31,967 |
| 2022 | 31,484 | 26,671 | 23,074 | 22,994 | 15,664 | 11,561 | 15,684 | 20,388 | 20,150 | 20,116 | 28,842 | 33,817 |
| 2023 | 31,754 | 29,958 | 30,208 | 24,219 | 12,698 | 17,917 | 20,746 | 22,265 | 21,446 | 23,954 | 26,579 | 29,505 |
| 2024 | 34,163 | |||||||||||
| - = No Data Reported; -- = Not Applicable; NA = Not Available; W = Withheld to avoid disclosure of individual company data. |
| Release Date: 3/29/2024 |
| Next Release Date: 4/30/2024 |