|
Download Data (XLS File) |
|
||||||||
|
||||||||
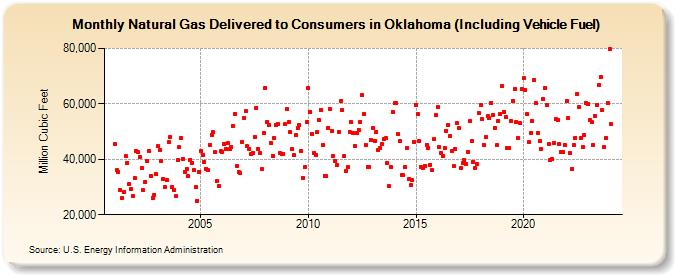
| Natural Gas Delivered to Consumers in Oklahoma (Including Vehicle Fuel) (Million Cubic Feet) | ||||||||
| Year | Jan | Feb | Mar | Apr | May | Jun | Jul | Aug | Sep | Oct | Nov | Dec |
|---|---|---|---|---|---|---|---|---|---|---|---|---|
| 2001 | 45,337 | 36,026 | 35,468 | 29,023 | 26,153 | 28,194 | 41,056 | 38,697 | 30,910 | 29,194 | 26,719 | 33,193 |
| 2002 | 42,957 | 42,546 | 40,981 | 36,989 | 28,784 | 31,741 | 39,440 | 43,092 | 34,007 | 26,058 | 27,197 | 34,574 |
| 2003 | 44,633 | 43,363 | 39,395 | 32,941 | 30,147 | 32,417 | 46,076 | 47,914 | 30,139 | 28,937 | 26,588 | 39,627 |
| 2004 | 44,286 | 47,720 | 40,198 | 35,528 | 36,608 | 33,843 | 39,855 | 38,791 | 36,056 | 30,069 | 25,036 | 35,444 |
| 2005 | 42,941 | 41,516 | 38,987 | 36,599 | 35,972 | 45,327 | 48,696 | 49,698 | 42,454 | 32,097 | 30,402 | 42,813 |
| 2006 | 42,641 | 45,534 | 43,562 | 45,754 | 43,689 | 44,512 | 51,955 | 56,344 | 37,425 | 35,388 | 34,881 | 46,374 |
| 2007 | 55,048 | 57,329 | 44,646 | 43,762 | 41,758 | 42,250 | 47,969 | 58,650 | 43,759 | 42,172 | 36,392 | 49,540 |
| 2008 | 65,719 | 53,511 | 52,460 | 45,985 | 41,278 | 47,721 | 52,471 | 52,747 | 42,110 | 41,929 | 42,044 | 52,793 |
| 2009 | 58,085 | 53,514 | 49,717 | 43,705 | 41,393 | 48,694 | 51,273 | 52,428 | 43,134 | 33,410 | 37,221 | 53,351 |
| 2010 | 65,798 | 57,213 | 49,185 | 42,250 | 41,507 | 49,983 | 54,022 | 57,888 | 45,115 | 34,118 | 33,868 | 51,441 |
| 2011 | 58,090 | 50,288 | 41,159 | 39,333 | 37,793 | 49,987 | 60,959 | 57,859 | 41,029 | 35,768 | 37,192 | 49,758 |
| 2012 | 53,395 | 49,577 | 44,783 | 49,370 | 50,698 | 53,522 | 63,048 | 56,307 | 45,168 | 37,282 | 37,154 | 46,983 |
| 2013 | 51,408 | 46,744 | 49,775 | 43,495 | 44,025 | 45,462 | 47,225 | 47,565 | 38,808 | 30,222 | 37,150 | 57,178 |
| 2014 | 60,226 | 60,204 | 49,138 | 46,444 | 34,344 | 34,202 | 37,271 | 43,991 | 32,928 | 30,587 | 32,398 | 46,279 |
| 2015 | 59,662 | 56,194 | 46,515 | 37,061 | 36,866 | 37,710 | 45,294 | 44,244 | 38,036 | 36,072 | 47,163 | 55,967 |
| 2016 | 58,803 | 44,300 | 42,213 | 41,277 | 44,161 | 50,340 | 52,402 | 48,385 | 42,837 | 37,475 | 43,616 | 53,019 |
| 2017 | 51,332 | 36,737 | 38,586 | 39,678 | 38,458 | 42,803 | 53,668 | 46,650 | 39,181 | 36,849 | 38,115 | 56,590 |
| 2018 | 59,480 | 54,438 | 45,238 | 47,991 | 55,605 | 54,835 | 60,385 | 56,133 | 51,438 | 45,137 | 53,921 | 56,359 |
| 2019 | 66,353 | 57,219 | 55,169 | 44,211 | 44,026 | 53,901 | 61,199 | 65,246 | 53,578 | 47,679 | 53,129 | 65,381 |
| 2020 | 69,207 | 64,948 | 56,261 | 46,090 | 49,523 | 53,781 | 68,663 | 60,277 | 49,564 | 46,453 | 43,593 | 61,829 |
| 2021 | 65,666 | 59,575 | 45,524 | 39,874 | 40,178 | 46,004 | 54,596 | 54,314 | 45,411 | 42,508 | 42,525 | 45,328 |
| 2022 | 61,082 | 54,780 | 42,162 | 36,668 | 45,196 | 47,781 | 63,666 | 58,901 | 47,727 | 44,478 | 48,782 | 60,379 |
| 2023 | 59,850 | 54,087 | 53,395 | 45,226 | 55,627 | 59,751 | 66,776 | 69,615 | 57,693 | 44,363 | 47,759 | 60,364 |
| 2024 | 79,720 | |||||||||||
| - = No Data Reported; -- = Not Applicable; NA = Not Available; W = Withheld to avoid disclosure of individual company data. |
| Release Date: 3/29/2024 |
| Next Release Date: 4/30/2024 |