|
Download Data (XLS File) |
|
||||||||
|
||||||||
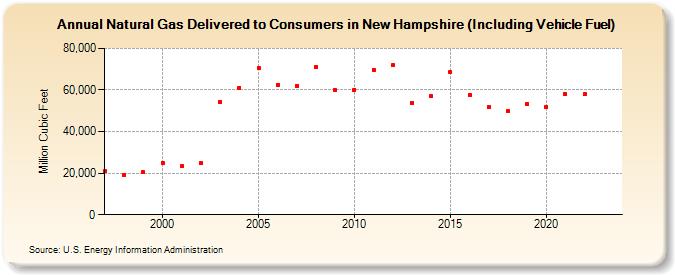
| Natural Gas Delivered to Consumers in New Hampshire (Including Vehicle Fuel) (Million Cubic Feet) | ||||||||
| Decade | Year-0 | Year-1 | Year-2 | Year-3 | Year-4 | Year-5 | Year-6 | Year-7 | Year-8 | Year-9 |
|---|---|---|---|---|---|---|---|---|---|---|
| 1990's | 20,824 | 19,105 | 20,311 | |||||||
| 2000's | 24,918 | 23,374 | 24,841 | 54,122 | 61,150 | 70,463 | 62,530 | 62,115 | 71,170 | 59,937 |
| 2010's | 60,131 | 69,776 | 72,004 | 53,961 | 56,933 | 68,596 | 57,765 | 51,885 | 49,742 | 53,487 |
| 2020's | 51,814 | 57,975 | 58,034 | NA |
| - = No Data Reported; -- = Not Applicable; NA = Not Available; W = Withheld to avoid disclosure of individual company data. |
| Release Date: 3/29/2024 |
| Next Release Date: 4/30/2024 |