|
Download Data (XLS File) |
|
||||||||
|
||||||||
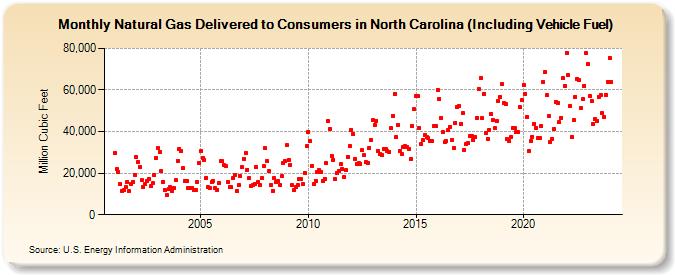
| Natural Gas Delivered to Consumers in North Carolina (Including Vehicle Fuel) (Million Cubic Feet) | ||||||||
| Year | Jan | Feb | Mar | Apr | May | Jun | Jul | Aug | Sep | Oct | Nov | Dec |
|---|---|---|---|---|---|---|---|---|---|---|---|---|
| 2001 | 29,800 | 21,808 | 20,434 | 14,585 | 11,544 | 11,979 | 13,229 | 15,763 | 11,364 | 14,905 | 15,898 | 19,179 |
| 2002 | 27,750 | 25,444 | 22,993 | 16,550 | 13,274 | 14,816 | 16,400 | 17,088 | 13,640 | 15,047 | 19,024 | 27,257 |
| 2003 | 32,135 | 30,180 | 20,979 | 15,717 | 12,038 | 9,338 | 12,359 | 13,177 | 11,210 | 12,814 | 16,520 | 25,999 |
| 2004 | 31,785 | 30,416 | 22,379 | 16,242 | 16,033 | 12,711 | 12,866 | 13,027 | 11,970 | 11,729 | 15,635 | 24,946 |
| 2005 | 30,538 | 27,324 | 26,203 | 17,851 | 13,162 | 12,669 | 15,688 | 16,197 | 12,616 | 12,082 | 15,331 | 25,731 |
| 2006 | 25,596 | 23,904 | 23,271 | 15,873 | 13,091 | 13,120 | 17,476 | 19,153 | 11,452 | 14,070 | 18,457 | 22,889 |
| 2007 | 26,988 | 29,743 | 21,686 | 17,606 | 13,644 | 14,343 | 14,640 | 22,849 | 15,744 | 14,159 | 17,540 | 23,411 |
| 2008 | 31,923 | 25,613 | 20,960 | 14,500 | 11,539 | 17,475 | 15,799 | 16,088 | 14,403 | 18,408 | 25,102 | 25,949 |
| 2009 | 33,360 | 26,215 | 24,096 | 14,130 | 11,754 | 13,141 | 14,301 | 17,248 | 17,018 | 14,783 | 20,251 | 32,818 |
| 2010 | 39,947 | 35,317 | 23,668 | 14,667 | 16,336 | 20,764 | 21,588 | 20,403 | 16,263 | 17,376 | 24,848 | 44,993 |
| 2011 | 41,316 | 28,258 | 26,456 | 17,165 | 19,834 | 21,001 | 24,168 | 22,004 | 18,096 | 21,311 | 27,931 | 32,941 |
| 2012 | 40,964 | 38,680 | 27,015 | 24,502 | 24,744 | 24,432 | 30,979 | 28,599 | 25,404 | 24,849 | 32,177 | 36,164 |
| 2013 | 45,419 | 43,334 | 45,240 | 30,555 | 29,254 | 28,663 | 31,638 | 31,729 | 30,748 | 30,312 | 41,672 | 47,583 |
| 2014 | 57,988 | 37,489 | 43,371 | 30,764 | 29,393 | 32,597 | 32,850 | 32,377 | 31,670 | 27,029 | 42,666 | 50,695 |
| 2015 | 56,943 | 56,908 | 41,790 | 33,961 | 35,730 | 38,410 | 37,444 | 36,748 | 35,567 | 35,315 | 42,679 | 42,741 |
| 2016 | 60,153 | 55,682 | 46,701 | 39,726 | 34,844 | 35,323 | 40,519 | 42,421 | 35,766 | 32,259 | 44,312 | 51,703 |
| 2017 | 52,350 | 43,699 | 48,773 | 31,129 | 33,826 | 34,441 | 37,775 | 37,877 | 35,871 | 37,168 | 46,755 | 60,579 |
| 2018 | 65,653 | 46,369 | 58,187 | 39,488 | 36,642 | 40,902 | 48,427 | 45,746 | 41,613 | 45,054 | 54,774 | 56,658 |
| 2019 | 62,834 | 53,864 | 53,401 | 36,285 | 35,651 | 37,536 | 41,818 | 41,919 | 39,745 | 39,823 | 51,745 | 55,019 |
| 2020 | 62,439 | 58,086 | 47,015 | 30,424 | 35,225 | 37,611 | 43,802 | 41,874 | 36,779 | 36,826 | 42,589 | 63,899 |
| 2021 | 68,729 | 57,350 | 47,284 | 35,204 | 36,651 | 41,335 | 54,394 | 53,632 | 44,405 | 46,759 | 65,669 | 62,003 |
| 2022 | 77,943 | 67,140 | 52,450 | 37,553 | 45,595 | 56,760 | 65,361 | 64,623 | 51,288 | 55,628 | 62,051 | 77,718 |
| 2023 | 72,457 | 57,032 | 54,760 | 43,735 | 45,910 | 45,234 | 56,710 | 57,501 | 48,791 | 47,186 | 57,707 | 63,868 |
| 2024 | 75,567 | |||||||||||
| - = No Data Reported; -- = Not Applicable; NA = Not Available; W = Withheld to avoid disclosure of individual company data. |
| Release Date: 3/29/2024 |
| Next Release Date: 4/30/2024 |