|
Download Data (XLS File) |
|
||||||||
|
||||||||
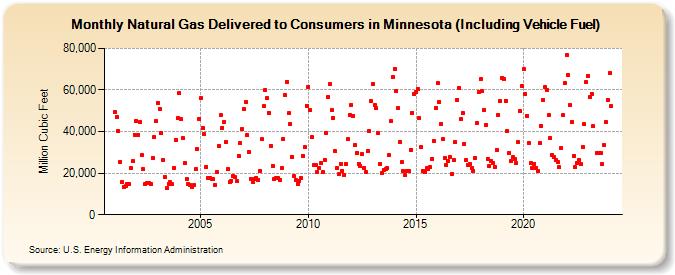
| Natural Gas Delivered to Consumers in Minnesota (Including Vehicle Fuel) (Million Cubic Feet) | ||||||||
| Year | Jan | Feb | Mar | Apr | May | Jun | Jul | Aug | Sep | Oct | Nov | Dec |
|---|---|---|---|---|---|---|---|---|---|---|---|---|
| 2001 | 49,278 | 47,192 | 40,209 | 25,541 | 15,943 | 13,524 | 13,674 | 14,855 | 14,705 | 22,582 | 25,778 | 38,517 |
| 2002 | 45,190 | 38,565 | 44,505 | 28,680 | 21,749 | 14,684 | 15,388 | 15,077 | 14,862 | 27,484 | 37,214 | 45,054 |
| 2003 | 53,794 | 50,612 | 39,189 | 26,415 | 18,135 | 12,708 | 14,981 | 15,594 | 14,570 | 22,649 | 35,945 | 46,332 |
| 2004 | 58,327 | 45,894 | 36,866 | 24,741 | 17,416 | 14,831 | 14,126 | 13,324 | 14,266 | 21,849 | 31,497 | 46,174 |
| 2005 | 56,027 | 41,821 | 38,832 | 22,877 | 17,882 | 17,797 | 17,093 | 17,307 | 14,377 | 20,659 | 33,116 | 47,767 |
| 2006 | 41,902 | 44,696 | 35,090 | 21,908 | 15,506 | 16,382 | 18,418 | 17,970 | 16,211 | 28,371 | 34,462 | 41,325 |
| 2007 | 50,785 | 54,311 | 38,294 | 30,066 | 17,212 | 15,828 | 17,397 | 17,832 | 16,930 | 21,258 | 36,293 | 52,204 |
| 2008 | 60,070 | 55,997 | 49,101 | 33,255 | 23,626 | 17,058 | 17,799 | 17,461 | 16,900 | 22,563 | 36,467 | 57,455 |
| 2009 | 64,062 | 48,716 | 43,629 | 27,945 | 18,403 | 16,792 | 14,854 | 16,139 | 17,738 | 28,471 | 32,332 | 52,481 |
| 2010 | 61,567 | 50,178 | 37,257 | 23,887 | 24,036 | 20,310 | 22,691 | 24,698 | 20,431 | 26,480 | 39,323 | 56,644 |
| 2011 | 62,720 | 50,157 | 46,720 | 30,406 | 22,648 | 19,344 | 24,458 | 21,219 | 18,965 | 24,491 | 36,280 | 48,139 |
| 2012 | 52,862 | 47,573 | 33,503 | 29,793 | 24,602 | 23,449 | 29,158 | 22,700 | 20,382 | 30,599 | 40,154 | 54,647 |
| 2013 | 62,831 | 52,860 | 51,197 | 39,173 | 24,447 | 20,239 | 21,412 | 21,919 | 22,398 | 28,650 | 44,921 | 66,202 |
| 2014 | 70,320 | 59,267 | 51,164 | 35,166 | 25,242 | 20,872 | 18,862 | 21,266 | 20,911 | 31,291 | 49,151 | 58,085 |
| 2015 | 59,139 | 60,511 | 46,463 | 32,486 | 21,246 | 20,335 | 22,278 | 22,035 | 22,743 | 26,927 | 35,555 | 51,440 |
| 2016 | 63,197 | 54,432 | 43,567 | 36,311 | 27,447 | 23,830 | 25,641 | 27,604 | 19,712 | 26,289 | 34,989 | 55,355 |
| 2017 | 60,948 | 45,993 | 49,053 | 34,062 | 26,343 | 23,730 | 24,605 | 22,426 | 21,103 | 27,504 | 44,230 | 59,057 |
| 2018 | 65,270 | 59,360 | 50,354 | 43,165 | 26,940 | 23,470 | 25,794 | 25,021 | 23,114 | 31,273 | 48,156 | 54,636 |
| 2019 | 65,925 | 65,208 | 54,830 | 40,315 | 29,711 | 25,875 | 27,597 | 26,878 | 24,915 | 34,752 | 49,649 | 62,034 |
| 2020 | 69,889 | 57,951 | 47,627 | 34,388 | 25,090 | 22,606 | 24,632 | 22,452 | 21,218 | 34,383 | 42,555 | 55,324 |
| 2021 | 61,333 | 60,187 | 47,929 | 36,839 | 28,606 | 27,583 | 26,534 | 25,306 | 22,791 | 31,981 | 47,798 | 63,256 |
| 2022 | 76,700 | 67,057 | 52,838 | 44,592 | 28,464 | 22,752 | 24,844 | 26,362 | 24,253 | 32,406 | 43,393 | 63,614 |
| 2023 | 66,810 | 56,509 | 56,727 | 42,517 | NA | 27,813 | 29,020 | 30,401 | 24,176 | 33,500 | 44,558 | 55,254 |
| 2024 | 68,259 | |||||||||||
| - = No Data Reported; -- = Not Applicable; NA = Not Available; W = Withheld to avoid disclosure of individual company data. |
| Release Date: 3/29/2024 |
| Next Release Date: 4/30/2024 |