|
Download Data (XLS File) |
|
||||||||
|
||||||||
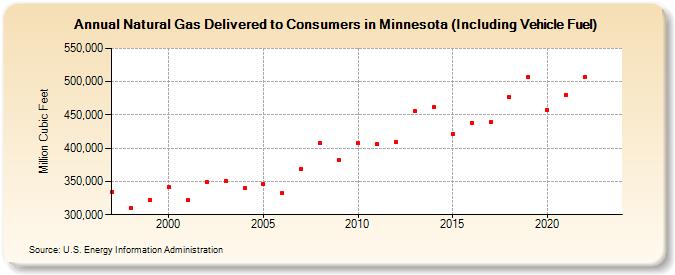
| Natural Gas Delivered to Consumers in Minnesota (Including Vehicle Fuel) (Million Cubic Feet) | ||||||||
| Decade | Year-0 | Year-1 | Year-2 | Year-3 | Year-4 | Year-5 | Year-6 | Year-7 | Year-8 | Year-9 |
|---|---|---|---|---|---|---|---|---|---|---|
| 1990's | 334,583 | 310,419 | 322,572 | |||||||
| 2000's | 340,988 | 321,867 | 348,523 | 351,009 | 339,407 | 345,573 | 332,257 | 368,428 | 407,767 | 381,577 |
| 2010's | 407,503 | 405,547 | 409,421 | 456,247 | 461,598 | 421,158 | 438,374 | 439,053 | 476,552 | 507,687 |
| 2020's | 458,116 | 480,144 | 507,275 | NA |
| - = No Data Reported; -- = Not Applicable; NA = Not Available; W = Withheld to avoid disclosure of individual company data. |
| Release Date: 3/29/2024 |
| Next Release Date: 4/30/2024 |