|
Download Data (XLS File) |
|
||||||||
|
||||||||
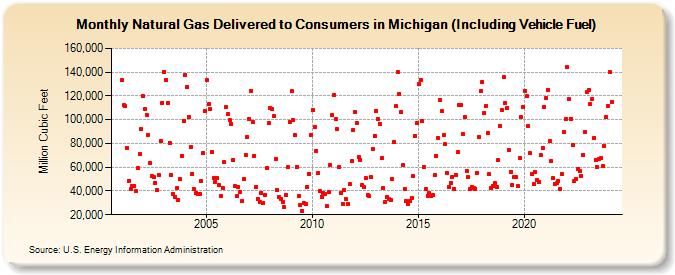
| Natural Gas Delivered to Consumers in Michigan (Including Vehicle Fuel) (Million Cubic Feet) | ||||||||
| Year | Jan | Feb | Mar | Apr | May | Jun | Jul | Aug | Sep | Oct | Nov | Dec |
|---|---|---|---|---|---|---|---|---|---|---|---|---|
| 2001 | 133,140 | 112,047 | 111,301 | 76,191 | 48,707 | 41,686 | 43,845 | 44,577 | 40,142 | 59,283 | 71,352 | 92,053 |
| 2002 | 119,902 | 108,891 | 104,208 | 87,138 | 63,810 | 52,457 | 51,899 | 47,094 | 40,938 | 53,419 | 82,015 | 114,268 |
| 2003 | 140,545 | 133,702 | 114,085 | 80,651 | 53,258 | 37,279 | 35,261 | 42,115 | 32,744 | 49,901 | 69,659 | 99,067 |
| 2004 | 137,906 | 127,671 | 102,442 | 76,978 | 54,610 | 41,310 | 38,001 | 37,565 | 37,285 | 48,239 | 71,870 | 107,025 |
| 2005 | 133,079 | 112,812 | 108,608 | 72,884 | 50,886 | 47,768 | 50,667 | 44,890 | 35,502 | 42,661 | 64,574 | 111,058 |
| 2006 | 104,803 | 99,454 | 96,633 | 65,814 | 43,901 | 35,824 | 43,332 | 39,459 | 31,740 | 50,167 | 70,643 | 85,634 |
| 2007 | 100,406 | 124,441 | 98,314 | 69,491 | 43,699 | 33,353 | 30,415 | 38,655 | 30,211 | 36,831 | 59,171 | 97,411 |
| 2008 | 109,742 | 109,072 | 102,939 | 66,601 | 40,748 | 34,807 | 33,456 | 30,303 | 26,459 | 36,435 | 59,847 | 98,089 |
| 2009 | 123,880 | 99,718 | 86,941 | 60,568 | 36,140 | 28,010 | 23,502 | 30,274 | 29,228 | 43,434 | 54,444 | 86,964 |
| 2010 | 108,463 | 93,556 | 73,820 | 55,007 | 40,209 | 35,215 | 38,319 | 37,119 | 27,492 | 38,870 | 61,727 | 103,736 |
| 2011 | 120,903 | 100,201 | 91,870 | 60,111 | 38,189 | 29,093 | 40,899 | 33,096 | 29,401 | 45,549 | 65,163 | 91,293 |
| 2012 | 106,613 | 97,521 | 68,205 | 66,019 | 44,822 | 42,974 | 50,507 | 36,482 | 35,444 | 51,693 | 74,959 | 86,306 |
| 2013 | 107,225 | 100,653 | 96,174 | 67,617 | 42,331 | 30,649 | 34,854 | 33,322 | 32,537 | 49,664 | 81,484 | 111,093 |
| 2014 | 140,025 | 121,808 | 106,270 | 61,749 | 41,608 | 31,716 | 29,027 | 31,913 | 34,192 | 52,451 | 86,279 | 97,179 |
| 2015 | 129,763 | 133,779 | 98,500 | 60,297 | 41,295 | 36,079 | 38,035 | 36,156 | 36,302 | 53,762 | 69,425 | 84,766 |
| 2016 | 116,614 | 107,023 | 87,032 | 79,238 | 55,178 | 43,592 | 46,709 | 51,921 | 42,019 | 53,571 | 72,547 | 112,515 |
| 2017 | 112,535 | 87,899 | 102,279 | 57,100 | 51,557 | 41,389 | 43,331 | 42,448 | 41,900 | 55,172 | 85,615 | 124,221 |
| 2018 | 132,122 | 105,909 | 111,549 | 89,080 | 53,854 | 42,413 | 44,414 | 46,593 | 43,003 | 65,653 | 95,082 | 108,209 |
| 2019 | 135,875 | 114,202 | 110,131 | 74,319 | 56,251 | 44,729 | 51,540 | 51,708 | 44,366 | 67,683 | 102,043 | 110,939 |
| 2020 | 124,364 | 119,619 | 94,742 | 71,712 | 54,059 | 45,883 | 55,836 | 49,049 | 47,177 | 70,222 | 76,449 | 110,635 |
| 2021 | 118,509 | 125,372 | 81,702 | 65,305 | 50,715 | 46,223 | 46,302 | 48,663 | 41,393 | 54,143 | 89,546 | 100,268 |
| 2022 | 144,107 | 117,292 | 100,811 | 78,719 | 47,995 | 50,475 | 58,242 | 57,142 | 52,595 | 70,322 | 89,476 | 123,148 |
| 2023 | 124,566 | 113,169 | 117,529 | 84,834 | 66,297 | 59,748 | 67,194 | 67,360 | 61,087 | 78,016 | 102,133 | 111,914 |
| 2024 | 140,465 | 115,099 | ||||||||||
| - = No Data Reported; -- = Not Applicable; NA = Not Available; W = Withheld to avoid disclosure of individual company data. |
| Release Date: 4/30/2024 |
| Next Release Date: 5/31/2024 |