|
Download Data (XLS File) |
|
||||||||
|
||||||||
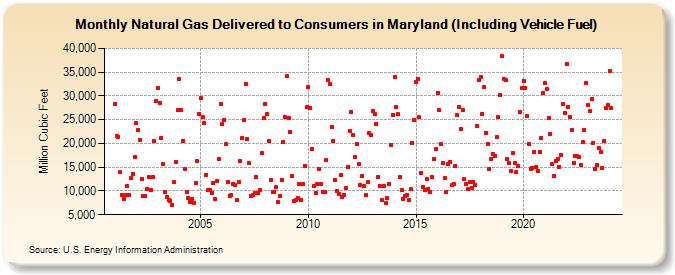
| Natural Gas Delivered to Consumers in Maryland (Including Vehicle Fuel) (Million Cubic Feet) | ||||||||
| Year | Jan | Feb | Mar | Apr | May | Jun | Jul | Aug | Sep | Oct | Nov | Dec |
|---|---|---|---|---|---|---|---|---|---|---|---|---|
| 2001 | 28,398 | 21,618 | 21,408 | 13,900 | 9,252 | 8,342 | 9,046 | 11,007 | 9,109 | 12,662 | 13,558 | 17,125 |
| 2002 | 24,221 | 22,802 | 20,670 | 12,534 | 8,846 | 8,846 | 10,514 | 12,842 | 10,157 | 12,911 | 20,408 | 28,827 |
| 2003 | 31,739 | 28,530 | 21,240 | 15,685 | 9,809 | 8,723 | 8,128 | 7,986 | 7,131 | 11,863 | 16,167 | 27,049 |
| 2004 | 33,576 | 27,062 | 20,558 | 14,623 | 9,867 | 8,560 | 7,704 | 8,271 | 7,535 | 11,725 | 16,222 | 26,279 |
| 2005 | 29,469 | 25,497 | 24,272 | 13,414 | 10,273 | 10,104 | 9,641 | 11,634 | 8,302 | 12,060 | 16,807 | 28,263 |
| 2006 | 24,101 | 24,846 | 19,870 | 11,807 | 9,034 | 9,251 | 11,438 | 11,236 | 8,042 | 11,895 | 16,300 | 21,239 |
| 2007 | 24,841 | 32,498 | 20,950 | 15,805 | 8,835 | 9,239 | 9,540 | 12,974 | 9,655 | 10,242 | 17,911 | 25,311 |
| 2008 | 28,394 | 26,094 | 20,551 | 12,340 | 9,832 | 9,808 | 10,778 | 7,669 | 8,974 | 12,394 | 20,316 | 25,502 |
| 2009 | 34,135 | 25,332 | 22,416 | 13,239 | 7,959 | 8,115 | 8,603 | 11,500 | 8,049 | 11,443 | 15,346 | 27,643 |
| 2010 | 31,913 | 27,395 | 18,842 | 11,027 | 9,569 | 11,442 | 14,557 | 11,415 | 9,836 | 9,748 | 16,571 | 33,373 |
| 2011 | 32,442 | 23,536 | 20,605 | 12,204 | 9,987 | 9,430 | 13,389 | 8,824 | 9,243 | 10,637 | 14,996 | 22,629 |
| 2012 | 26,635 | 21,692 | 17,240 | 19,953 | 15,653 | 11,307 | 13,150 | 11,114 | 9,047 | 11,886 | 22,191 | 21,681 |
| 2013 | 26,783 | 26,138 | 24,176 | 13,041 | 11,055 | 8,100 | 11,016 | 7,379 | 8,433 | 11,519 | 19,593 | 25,999 |
| 2014 | 33,911 | 27,650 | 26,177 | 12,958 | 10,196 | 8,352 | 8,983 | 9,114 | 8,058 | 10,322 | 20,099 | 24,936 |
| 2015 | 32,824 | 33,570 | 25,471 | 13,763 | 10,812 | 10,299 | 12,444 | 10,485 | 9,873 | 12,836 | 16,636 | 18,802 |
| 2016 | 30,715 | 26,982 | 19,870 | 15,811 | 12,680 | 9,865 | 15,594 | 16,145 | 11,207 | 11,489 | 15,327 | 25,895 |
| 2017 | 27,594 | 22,994 | 27,018 | 12,503 | 11,475 | 10,393 | 11,948 | 10,676 | 11,937 | 11,358 | 23,738 | 33,279 |
| 2018 | 34,065 | 26,266 | 31,789 | 22,284 | 19,904 | 14,656 | 16,825 | 17,857 | 17,315 | 21,292 | 25,524 | 30,199 |
| 2019 | 38,299 | 33,609 | 33,253 | 16,638 | 15,925 | 14,239 | 17,889 | 15,980 | 14,025 | 15,342 | 26,644 | 31,650 |
| 2020 | 33,216 | 31,642 | 25,779 | 19,833 | 14,695 | 14,753 | 18,287 | 15,096 | 14,208 | 18,279 | 21,237 | 30,640 |
| 2021 | 32,633 | 31,439 | 25,370 | 22,061 | 15,624 | 13,096 | 16,372 | 16,765 | 15,111 | 17,566 | 28,286 | 26,403 |
| 2022 | 36,797 | 27,705 | 25,605 | 22,930 | 15,983 | 17,394 | 17,335 | 17,092 | 15,446 | 20,232 | 22,864 | 32,681 |
| 2023 | 28,156 | 26,812 | 29,353 | 20,181 | 14,525 | 15,525 | 19,018 | 18,118 | 14,858 | 20,409 | 27,376 | 28,109 |
| 2024 | 35,214 | 27,384 | 22,271 | 21,570 | 14,863 | 14,934 | ||||||
| - = No Data Reported; -- = Not Applicable; NA = Not Available; W = Withheld to avoid disclosure of individual company data. |
| Release Date: 8/30/2024 |
| Next Release Date: 9/30/2024 |