|
Download Data (XLS File) |
|
||||||||
|
||||||||
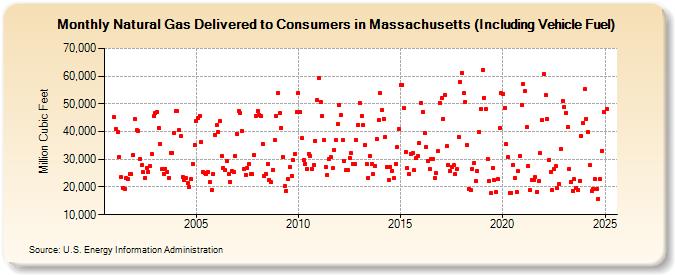
| Natural Gas Delivered to Consumers in Massachusetts (Including Vehicle Fuel) (Million Cubic Feet) | ||||||||
| Year | Jan | Feb | Mar | Apr | May | Jun | Jul | Aug | Sep | Oct | Nov | Dec |
|---|---|---|---|---|---|---|---|---|---|---|---|---|
| 2001 | 45,181 | 40,868 | 39,690 | 30,815 | 23,495 | 19,798 | 19,305 | 23,154 | 22,753 | 24,627 | 24,646 | 31,456 |
| 2002 | 44,559 | 40,420 | 40,295 | 29,989 | 27,757 | 25,316 | 23,254 | 26,957 | 25,422 | 27,484 | 31,958 | 45,435 |
| 2003 | 46,732 | 47,096 | 41,405 | 35,646 | 26,400 | 24,827 | 26,581 | 25,461 | 23,294 | 32,416 | 32,407 | 39,583 |
| 2004 | 47,337 | 47,355 | 40,517 | 38,312 | 23,705 | 22,360 | 23,202 | 21,585 | 20,120 | 22,710 | 28,310 | 35,091 |
| 2005 | 43,684 | 45,004 | 45,737 | 36,162 | 25,515 | 25,040 | 24,822 | 25,383 | 21,751 | 18,920 | 24,651 | 38,819 |
| 2006 | 42,251 | 39,967 | 43,664 | 31,251 | 26,934 | 25,998 | 29,288 | 24,626 | 21,947 | 25,785 | 25,506 | 31,234 |
| 2007 | 39,141 | 47,516 | 46,572 | 40,133 | 26,516 | 24,423 | 26,937 | 28,310 | 24,665 | 24,748 | 31,610 | 45,696 |
| 2008 | 47,408 | 46,100 | 45,481 | 35,633 | 23,986 | 24,767 | 28,392 | 22,683 | 21,637 | 26,229 | 36,922 | 45,568 |
| 2009 | 53,869 | 46,564 | 41,447 | 30,642 | 20,236 | 18,616 | 22,791 | 27,143 | 23,998 | 29,583 | 32,022 | 47,079 |
| 2010 | 53,898 | 46,881 | 37,531 | 29,586 | 28,325 | 26,532 | 32,005 | 31,238 | 26,452 | 27,976 | 36,684 | 51,363 |
| 2011 | 59,371 | 50,826 | 45,627 | 36,862 | 27,391 | 24,246 | 30,015 | 30,670 | 26,718 | 33,368 | 36,860 | 42,582 |
| 2012 | 49,526 | 46,025 | 36,959 | 29,210 | 25,959 | 26,214 | 30,618 | 32,098 | 28,435 | 28,199 | 36,974 | 42,420 |
| 2013 | 50,263 | 45,652 | 42,328 | 35,147 | 28,245 | 23,370 | 31,202 | 28,467 | 24,543 | 27,690 | 37,185 | 44,149 |
| 2014 | 53,771 | 47,769 | 44,694 | 38,084 | 27,292 | 22,385 | 27,305 | 25,776 | 23,092 | 28,321 | 34,407 | 40,965 |
| 2015 | 56,732 | 56,909 | 48,538 | 32,698 | 26,798 | 24,702 | 31,968 | 32,327 | 26,010 | 30,340 | 31,121 | 35,848 |
| 2016 | 50,432 | 47,175 | 39,498 | 34,459 | 29,521 | 26,479 | 30,228 | 30,155 | 23,309 | 25,040 | 32,838 | 50,315 |
| 2017 | 52,121 | 44,661 | 53,317 | 34,677 | 28,053 | 25,689 | 27,329 | 27,825 | 24,628 | 26,389 | 38,033 | 58,012 |
| 2018 | 61,282 | 53,895 | 50,795 | 34,995 | 19,253 | 18,904 | 26,528 | 28,736 | 22,131 | 25,868 | 39,981 | 48,068 |
| 2019 | 62,226 | 52,258 | 48,182 | 30,029 | 22,161 | 17,660 | 26,964 | 22,503 | 18,225 | 22,869 | 41,163 | 54,040 |
| 2020 | 53,713 | 48,595 | 35,380 | 30,669 | 17,885 | 17,947 | 28,098 | 23,320 | 18,231 | 25,741 | 31,246 | 49,703 |
| 2021 | 57,208 | 54,513 | 41,515 | 27,512 | 18,790 | 22,681 | 22,516 | 23,443 | 18,351 | 22,142 | 32,241 | 44,288 |
| 2022 | 62,193 | 53,961 | 45,298 | 29,943 | 24,769 | 19,770 | 25,667 | 25,308 | 19,844 | 21,680 | 34,476 | 52,240 |
| 2023 | 46,511 | 42,930 | 39,556 | 25,604 | 21,103 | 18,157 | 22,335 | 19,015 | 18,443 | 21,520 | 36,446 | 41,053 |
| 2024 | 55,239 | |||||||||||
| - = No Data Reported; -- = Not Applicable; NA = Not Available; W = Withheld to avoid disclosure of individual company data. |
| Release Date: 3/29/2024 |
| Next Release Date: 4/30/2024 |