|
Download Data (XLS File) |
|
||||||||
|
||||||||
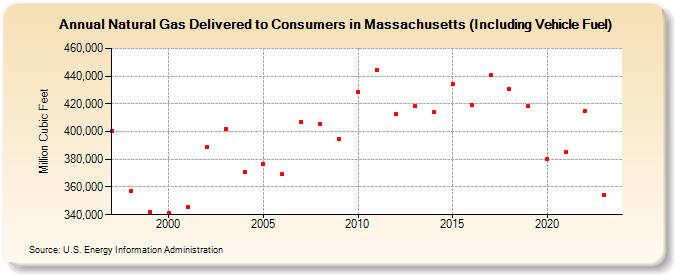
| Natural Gas Delivered to Consumers in Massachusetts (Including Vehicle Fuel) (Million Cubic Feet) | ||||||||
| Decade | Year-0 | Year-1 | Year-2 | Year-3 | Year-4 | Year-5 | Year-6 | Year-7 | Year-8 | Year-9 |
|---|---|---|---|---|---|---|---|---|---|---|
| 1990's | 400,273 | 356,942 | 342,136 | |||||||
| 2000's | 340,923 | 345,916 | 388,972 | 402,003 | 370,777 | 376,257 | 369,166 | 406,968 | 405,562 | 394,759 |
| 2010's | 428,471 | 444,537 | 412,637 | 418,241 | 413,860 | 433,991 | 419,448 | 440,735 | 430,438 | 418,280 |
| 2020's | 380,527 | 385,197 | 415,148 | 352,673 |
| - = No Data Reported; -- = Not Applicable; NA = Not Available; W = Withheld to avoid disclosure of individual company data. |
| Release Date: 3/29/2024 |
| Next Release Date: 4/30/2024 |