|
Download Data (XLS File) |
|
||||||||
|
||||||||
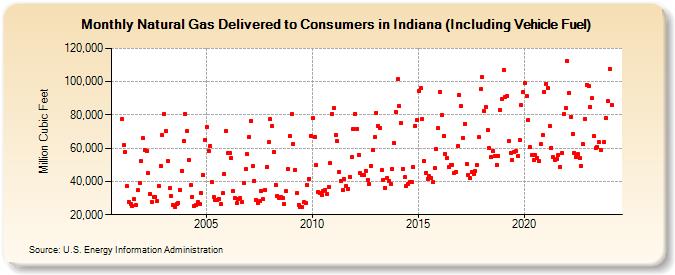
| Natural Gas Delivered to Consumers in Indiana (Including Vehicle Fuel) (Million Cubic Feet) | ||||||||
| Year | Jan | Feb | Mar | Apr | May | Jun | Jul | Aug | Sep | Oct | Nov | Dec |
|---|---|---|---|---|---|---|---|---|---|---|---|---|
| 2001 | 77,275 | 61,840 | 57,608 | 37,045 | 27,762 | 26,685 | 25,473 | 29,184 | 25,697 | 34,650 | 39,146 | 51,997 |
| 2002 | 65,893 | 58,962 | 58,569 | 44,882 | 32,659 | 27,696 | 30,899 | 30,668 | 28,357 | 37,204 | 49,556 | 68,056 |
| 2003 | 80,534 | 70,155 | 52,368 | 35,903 | 31,266 | 25,652 | 24,580 | 26,666 | 27,072 | 34,914 | 46,556 | 64,253 |
| 2004 | 80,680 | 70,341 | 53,056 | 37,842 | 30,840 | 25,006 | 25,592 | 27,498 | 26,658 | 33,102 | 43,630 | 65,054 |
| 2005 | 72,775 | 58,428 | 61,390 | 39,473 | 30,697 | 28,897 | 28,628 | 29,602 | 26,476 | 32,838 | 44,576 | 70,488 |
| 2006 | 56,899 | 57,392 | 54,200 | 34,311 | 30,004 | 26,873 | 29,579 | 29,996 | 27,630 | 39,210 | 47,253 | 56,403 |
| 2007 | 66,914 | 76,347 | 49,045 | 40,498 | 29,129 | 27,272 | 28,150 | 34,503 | 29,267 | 35,013 | 48,878 | 63,510 |
| 2008 | 77,386 | 73,487 | 57,916 | 38,129 | 31,225 | 30,240 | 30,652 | 29,873 | 26,242 | 33,987 | 47,500 | 67,443 |
| 2009 | 80,503 | 62,657 | 46,963 | 32,918 | 26,031 | 24,864 | 24,648 | 27,394 | 27,205 | 37,690 | 41,578 | 67,604 |
| 2010 | 78,386 | 66,864 | 49,998 | 33,745 | 33,295 | 31,825 | 34,420 | 35,059 | 32,659 | 36,835 | 51,089 | 80,728 |
| 2011 | 83,924 | 67,710 | 64,109 | 45,918 | 40,513 | 34,564 | 41,185 | 37,179 | 35,478 | 42,828 | 54,755 | 71,815 |
| 2012 | 80,739 | 71,705 | 55,978 | 44,826 | 44,151 | 43,677 | 46,324 | 41,094 | 38,619 | 49,575 | 58,917 | 66,603 |
| 2013 | 81,317 | 73,367 | 72,206 | 46,792 | 41,163 | 36,362 | 42,050 | 40,542 | 38,390 | 47,597 | 63,191 | 81,839 |
| 2014 | 101,410 | 85,285 | 75,123 | 47,750 | 42,393 | 37,104 | 38,204 | 39,624 | 39,587 | 48,693 | 73,513 | 77,098 |
| 2015 | 94,388 | 96,065 | 77,653 | 52,110 | 45,248 | 41,480 | 43,055 | 42,240 | 39,639 | 47,886 | 59,397 | 72,029 |
| 2016 | 93,837 | 80,093 | 67,425 | 56,286 | 54,324 | 48,813 | 50,085 | 49,930 | 45,236 | 45,894 | 61,099 | 91,896 |
| 2017 | 85,152 | 66,139 | 74,728 | 50,782 | 43,954 | 41,905 | 45,742 | 44,553 | 46,194 | 50,029 | 66,560 | 95,324 |
| 2018 | 102,503 | 82,188 | 84,658 | 70,882 | 59,921 | 54,471 | 58,259 | 55,142 | 50,014 | 55,325 | 83,049 | 89,356 |
| 2019 | 107,163 | 90,599 | 91,546 | 64,142 | 57,332 | 53,105 | 57,707 | 58,335 | 55,276 | 64,843 | 85,735 | 93,763 |
| 2020 | 99,021 | 91,298 | 77,021 | 60,480 | 55,697 | 52,630 | 55,781 | 54,232 | 52,119 | 62,423 | 67,975 | 93,880 |
| 2021 | 98,640 | 96,106 | 73,258 | 60,357 | 54,647 | 53,140 | 53,781 | 55,944 | 48,548 | 57,170 | 80,485 | 83,913 |
| 2022 | 112,372 | 93,432 | 79,031 | 68,421 | 57,294 | 54,925 | 56,496 | 54,074 | 49,521 | 62,314 | 77,795 | 98,152 |
| 2023 | 97,255 | 85,017 | 90,028 | 67,312 | 59,986 | 60,641 | 63,500 | 59,161 | NA | 63,698 | 78,135 | 88,452 |
| 2024 | 107,735 | |||||||||||
| - = No Data Reported; -- = Not Applicable; NA = Not Available; W = Withheld to avoid disclosure of individual company data. |
| Release Date: 3/29/2024 |
| Next Release Date: 4/30/2024 |