|
Download Data (XLS File) |
|
||||||||
|
||||||||
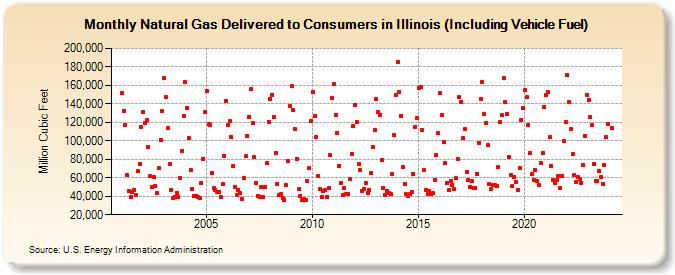
| Natural Gas Delivered to Consumers in Illinois (Including Vehicle Fuel) (Million Cubic Feet) | ||||||||
| Year | Jan | Feb | Mar | Apr | May | Jun | Jul | Aug | Sep | Oct | Nov | Dec |
|---|---|---|---|---|---|---|---|---|---|---|---|---|
| 2001 | 151,699 | 132,638 | 117,186 | 62,934 | 46,113 | 39,615 | 44,463 | 46,777 | 41,870 | 67,167 | 74,519 | 115,418 |
| 2002 | 131,434 | 119,430 | 122,242 | 93,668 | 61,529 | 49,664 | 60,624 | 51,277 | 43,656 | 70,127 | 100,944 | 131,720 |
| 2003 | 167,855 | 147,181 | 114,072 | 74,457 | 47,169 | 38,291 | 39,012 | 43,781 | 39,310 | 59,953 | 89,354 | 127,165 |
| 2004 | 163,310 | 135,906 | 102,899 | 68,328 | 47,779 | 40,404 | 40,176 | 39,133 | 37,585 | 53,947 | 80,742 | 131,346 |
| 2005 | 153,861 | 118,319 | 117,462 | 65,549 | 48,798 | 46,244 | 44,217 | 44,371 | 39,592 | 52,800 | 83,616 | 143,580 |
| 2006 | 116,915 | 121,058 | 104,406 | 73,083 | 49,546 | 41,255 | 47,256 | 43,727 | 36,875 | 59,300 | 83,859 | 105,529 |
| 2007 | 125,762 | 156,021 | 118,955 | 82,569 | 54,760 | 40,126 | 39,665 | 50,126 | 38,843 | 50,053 | 76,194 | 120,782 |
| 2008 | 144,934 | 149,486 | 125,866 | 87,177 | 53,552 | 41,567 | 42,200 | 37,929 | 35,830 | 52,062 | 78,310 | 137,991 |
| 2009 | 159,394 | 132,967 | 112,576 | 80,429 | 47,369 | 40,772 | 35,663 | 37,150 | 36,445 | 56,477 | 70,083 | 121,766 |
| 2010 | 152,282 | 126,351 | 103,714 | 61,511 | 48,002 | 39,505 | 45,283 | 46,405 | 39,487 | 49,202 | 84,243 | 146,221 |
| 2011 | 161,150 | 128,139 | 108,602 | 72,616 | 54,569 | 40,976 | 49,060 | 42,862 | 42,201 | 58,375 | 85,496 | 115,971 |
| 2012 | 138,760 | 120,636 | 74,579 | 68,161 | 46,112 | 47,304 | 54,448 | 43,629 | 46,414 | 64,878 | 93,613 | 112,077 |
| 2013 | 145,385 | 130,938 | 128,302 | 79,551 | 49,299 | 40,881 | 46,112 | 43,063 | 42,403 | 63,710 | 106,049 | 149,158 |
| 2014 | 185,421 | 152,540 | 126,843 | 71,889 | 53,342 | 41,986 | 40,005 | 42,266 | 44,941 | 63,812 | 114,971 | 124,886 |
| 2015 | 156,762 | 158,444 | 112,156 | 67,860 | 46,823 | 42,018 | 45,902 | 42,179 | 43,482 | 57,688 | 85,107 | 107,941 |
| 2016 | 151,561 | 128,247 | 98,353 | 76,116 | 54,860 | 46,464 | 56,561 | 52,694 | 47,408 | 59,457 | 80,793 | 147,431 |
| 2017 | 142,312 | 102,940 | 112,941 | 66,635 | 57,632 | 49,978 | 56,473 | 48,851 | 49,296 | 63,887 | 97,921 | 145,755 |
| 2018 | 163,402 | 128,765 | 118,977 | 95,040 | 53,221 | 47,911 | 52,597 | 51,981 | 50,731 | 71,261 | 120,218 | 127,534 |
| 2019 | 167,753 | 141,687 | 128,870 | 82,394 | 62,533 | 50,933 | 60,405 | 55,356 | 47,034 | 70,035 | 122,391 | 135,153 |
| 2020 | 154,914 | 147,079 | 117,421 | 86,280 | 63,851 | 57,896 | 68,901 | 56,524 | 52,006 | 76,127 | 86,715 | 136,873 |
| 2021 | 149,635 | 152,322 | 104,016 | 72,475 | 57,041 | 53,932 | 57,100 | 62,371 | 48,926 | 62,353 | 99,888 | 120,859 |
| 2022 | 171,402 | 141,748 | 112,755 | 85,204 | 62,632 | 55,438 | 60,854 | 58,618 | 54,801 | 74,003 | 105,216 | 150,072 |
| 2023 | 144,045 | 125,443 | 117,453 | 74,650 | 56,630 | 56,716 | 67,156 | 60,610 | 53,772 | 74,230 | 103,656 | 117,844 |
| 2024 | NA | |||||||||||
| - = No Data Reported; -- = Not Applicable; NA = Not Available; W = Withheld to avoid disclosure of individual company data. |
| Release Date: 3/29/2024 |
| Next Release Date: 4/30/2024 |