|
Download Data (XLS File) |
|
||||||||
|
||||||||
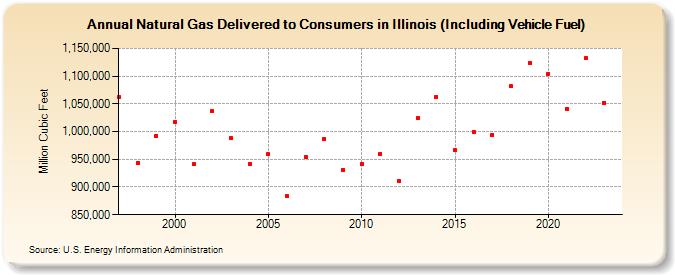
| Natural Gas Delivered to Consumers in Illinois (Including Vehicle Fuel) (Million Cubic Feet) | ||||||||
| Decade | Year-0 | Year-1 | Year-2 | Year-3 | Year-4 | Year-5 | Year-6 | Year-7 | Year-8 | Year-9 |
|---|---|---|---|---|---|---|---|---|---|---|
| 1990's | 1,062,536 | 944,170 | 992,865 | |||||||
| 2000's | 1,017,283 | 940,691 | 1,036,615 | 987,964 | 941,964 | 958,727 | 883,080 | 954,100 | 987,137 | 931,329 |
| 2010's | 942,205 | 960,018 | 910,611 | 1,024,851 | 1,062,904 | 966,363 | 999,944 | 994,620 | 1,081,636 | 1,124,543 |
| 2020's | 1,104,587 | 1,040,920 | 1,132,741 | 1,052,206 |
| - = No Data Reported; -- = Not Applicable; NA = Not Available; W = Withheld to avoid disclosure of individual company data. |
| Release Date: 3/29/2024 |
| Next Release Date: 4/30/2024 |