|
Download Data (XLS File) |
|
||||||||
|
||||||||
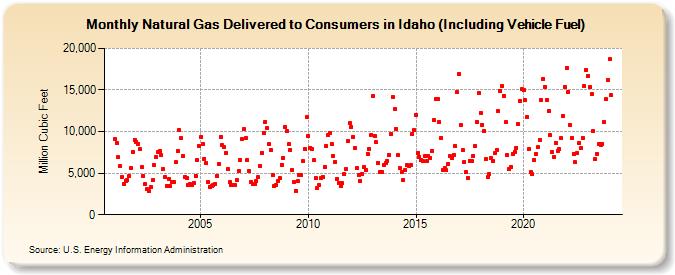
| Natural Gas Delivered to Consumers in Idaho (Including Vehicle Fuel) (Million Cubic Feet) | ||||||||
| Year | Jan | Feb | Mar | Apr | May | Jun | Jul | Aug | Sep | Oct | Nov | Dec |
|---|---|---|---|---|---|---|---|---|---|---|---|---|
| 2001 | 9,061 | 8,656 | 6,890 | 5,799 | 4,539 | 3,728 | 4,106 | 4,145 | 4,609 | 5,611 | 7,528 | 8,984 |
| 2002 | 8,747 | 8,547 | 7,861 | 5,699 | 4,667 | 3,654 | 3,038 | 2,812 | 3,303 | 4,162 | 5,950 | 7,000 |
| 2003 | 7,519 | 7,632 | 7,150 | 5,498 | 4,487 | 3,443 | 4,268 | 3,399 | 3,902 | 3,977 | 6,312 | 7,657 |
| 2004 | 10,168 | 9,168 | 7,032 | 4,556 | 4,391 | 3,602 | 3,672 | 3,601 | 3,844 | 4,668 | 6,536 | 8,238 |
| 2005 | 9,355 | 8,465 | 6,757 | 6,168 | 3,946 | 3,381 | 3,511 | 3,614 | 3,733 | 4,635 | 6,142 | 9,403 |
| 2006 | 8,375 | 8,140 | 7,439 | 5,455 | 3,877 | 3,562 | 3,628 | 3,580 | 4,158 | 5,229 | 6,622 | 9,056 |
| 2007 | 10,272 | 9,241 | 6,574 | 5,246 | 3,970 | 3,688 | 3,636 | 4,040 | 4,529 | 5,843 | 7,457 | 9,819 |
| 2008 | 11,163 | 10,467 | 8,471 | 7,774 | 4,801 | 3,497 | 3,518 | 4,056 | 4,375 | 6,014 | 6,853 | 10,599 |
| 2009 | 10,045 | 8,452 | 7,819 | 5,349 | 3,985 | 2,857 | 4,022 | 4,781 | 4,752 | 6,420 | 7,878 | 11,742 |
| 2010 | 9,471 | 8,054 | 7,929 | 6,521 | 4,434 | 3,252 | 3,563 | 4,355 | 4,520 | 5,748 | 8,257 | 9,544 |
| 2011 | 9,799 | 8,553 | 7,101 | 6,361 | 4,336 | 3,785 | 3,399 | 3,776 | 4,847 | 5,471 | 8,920 | 10,993 |
| 2012 | 10,595 | 9,310 | 8,038 | 5,598 | 4,731 | 4,033 | 4,955 | 5,724 | 5,408 | 7,340 | 7,903 | 9,639 |
| 2013 | 14,293 | 9,476 | 8,701 | 6,250 | 5,182 | 5,189 | 5,995 | 6,180 | 6,505 | 7,213 | 9,694 | 14,165 |
| 2014 | 12,675 | 10,339 | 7,164 | 5,579 | 5,099 | 4,218 | 5,378 | 5,931 | 5,901 | 5,948 | 9,750 | 10,163 |
| 2015 | 11,961 | 7,453 | 6,953 | 6,581 | 6,441 | 7,050 | 6,406 | 7,023 | 6,841 | 7,669 | 11,402 | 13,922 |
| 2016 | 13,896 | 11,131 | 9,231 | 5,351 | 5,578 | 5,340 | 6,148 | 7,021 | 6,813 | 7,195 | 8,280 | 14,718 |
| 2017 | 16,946 | 10,781 | 7,733 | 6,365 | 5,077 | 4,426 | 6,517 | 6,443 | 7,089 | 8,211 | 11,140 | 14,678 |
| 2018 | 12,270 | 10,828 | 10,071 | 6,691 | 4,493 | 4,906 | 6,841 | 6,481 | 7,401 | 7,752 | 12,434 | 14,932 |
| 2019 | 15,491 | 14,309 | 11,104 | 7,129 | 5,485 | 5,781 | 7,351 | 7,599 | 8,016 | 10,893 | 13,620 | 15,061 |
| 2020 | 15,037 | 13,759 | 11,751 | 7,865 | 5,178 | 4,846 | 6,635 | 7,314 | 8,106 | 9,037 | 13,750 | 16,323 |
| 2021 | 15,363 | 13,852 | 12,471 | 9,541 | 7,511 | 6,988 | 8,666 | 7,675 | 7,865 | 9,187 | 11,912 | 15,403 |
| 2022 | 16,911 | 14,306 | 10,744 | 8,636 | 7,344 | 5,222 | 7,342 | 8,502 | 8,013 | 9,620 | 16,437 | 18,055 |
| 2023 | 17,470 | 16,249 | 15,916 | 10,187 | 6,002 | 7,304 | 9,563 | 9,467 | 8,781 | 10,481 | 14,270 | 17,318 |
| 2024 | 20,819 | 15,729 | 14,302 | 8,425 | 6,600 | 8,222 | 10,251 | 10,775 | 10,079 | 9,796 | 15,478 | 18,141 |
| 2025 | 19,185 | 15,680 | 11,994 | 9,071 | 8,297 | 8,588 | 9,633 | 9,630 | 9,498 | 10,589 | 12,767 | 15,459 |
| 2026 | 17,462 | 13,816 | 10,638 | |||||||||
| - = No Data Reported; -- = Not Applicable; NA = Not Available; W = Withheld to avoid disclosure of individual company data. |
| Release Date: 5/29/2026 |
| Next Release Date: 6/30/2026 |