|
Download Data (XLS File) |
|
||||||||
|
||||||||
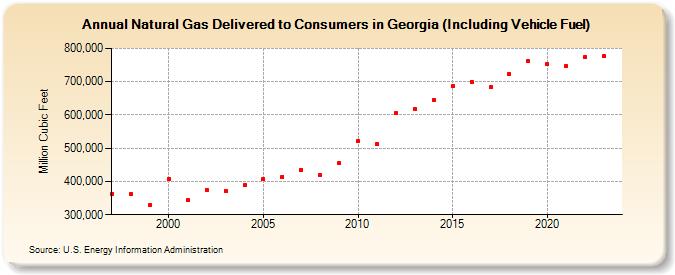
| Natural Gas Delivered to Consumers in Georgia (Including Vehicle Fuel) (Million Cubic Feet) | ||||||||
| Decade | Year-0 | Year-1 | Year-2 | Year-3 | Year-4 | Year-5 | Year-6 | Year-7 | Year-8 | Year-9 |
|---|---|---|---|---|---|---|---|---|---|---|
| 1990's | 363,402 | 360,973 | 328,730 | |||||||
| 2000's | 408,209 | 343,698 | 375,567 | 372,492 | 388,751 | 406,852 | 414,377 | 435,919 | 419,057 | 456,082 |
| 2010's | 521,557 | 512,466 | 605,262 | 617,310 | 645,431 | 687,008 | 699,777 | 682,707 | 723,747 | 761,710 |
| 2020's | 751,871 | 746,821 | 773,395 | 776,157 |
| - = No Data Reported; -- = Not Applicable; NA = Not Available; W = Withheld to avoid disclosure of individual company data. |
| Release Date: 3/29/2024 |
| Next Release Date: 4/30/2024 |