|
Download Data (XLS File) |
|
||||||||
|
||||||||
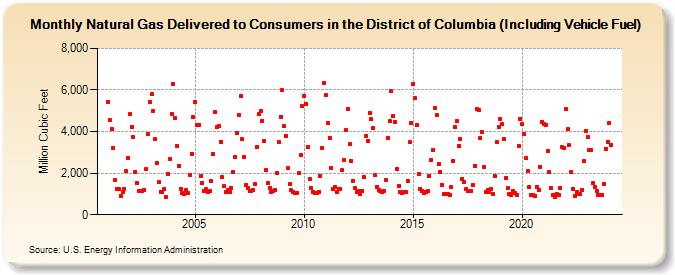
| Natural Gas Delivered to Consumers in the District of Columbia (Including Vehicle Fuel) (Million Cubic Feet) | ||||||||
| Year | Jan | Feb | Mar | Apr | May | Jun | Jul | Aug | Sep | Oct | Nov | Dec |
|---|---|---|---|---|---|---|---|---|---|---|---|---|
| 2001 | 5,440 | 4,546 | 4,141 | 3,185 | 1,654 | 1,252 | 1,226 | 905 | 1,087 | 1,231 | 2,088 | 2,737 |
| 2002 | 4,830 | 4,239 | 3,718 | 2,066 | 1,544 | 1,155 | 1,149 | 1,164 | 1,202 | 2,189 | 3,889 | 5,436 |
| 2003 | 5,818 | 4,995 | 3,621 | 2,478 | 1,550 | 1,112 | 1,094 | 1,240 | 844 | 1,963 | 2,691 | 4,848 |
| 2004 | 6,285 | 4,650 | 3,323 | 2,349 | 1,239 | 1,067 | 985 | 1,168 | 1,066 | 1,895 | 2,937 | 4,696 |
| 2005 | 5,419 | 4,311 | 4,308 | 1,880 | 1,539 | 1,133 | 1,217 | 1,100 | 1,124 | 1,628 | 2,941 | 4,935 |
| 2006 | 4,198 | 4,285 | 3,486 | 1,795 | 1,375 | 1,092 | 1,184 | 1,096 | 1,287 | 2,031 | 2,784 | 3,908 |
| 2007 | 4,799 | 5,702 | 3,629 | 2,760 | 1,444 | 1,280 | 1,122 | 1,134 | 1,182 | 1,498 | 3,275 | 4,843 |
| 2008 | 5,010 | 4,524 | 3,522 | 2,139 | 1,522 | 1,291 | 1,095 | 1,126 | 1,190 | 2,022 | 3,480 | 4,714 |
| 2009 | 5,975 | 4,247 | 3,799 | 2,225 | 1,463 | 1,175 | 1,109 | 1,040 | 1,064 | 1,998 | 2,861 | 5,212 |
| 2010 | 5,705 | 5,302 | 3,267 | 1,733 | 1,275 | 1,102 | 1,068 | 1,059 | 1,090 | 1,882 | 3,214 | 6,343 |
| 2011 | 5,758 | 4,417 | 3,703 | 2,262 | 1,235 | 1,327 | 1,112 | 1,236 | 1,256 | 2,132 | 2,642 | 4,079 |
| 2012 | 5,099 | 3,382 | 2,585 | 1,639 | 1,278 | 1,082 | 1,147 | 978 | 1,158 | 1,802 | 3,784 | 3,559 |
| 2013 | 4,914 | 4,582 | 4,164 | 1,893 | 1,357 | 1,184 | 1,121 | 1,087 | 1,150 | 1,662 | 3,694 | 4,501 |
| 2014 | 5,937 | 4,739 | 4,480 | 2,183 | 1,392 | 1,103 | 1,021 | 1,078 | 1,073 | 1,626 | 3,484 | 4,427 |
| 2015 | 6,278 | 5,596 | 4,299 | 1,942 | 1,250 | 1,143 | 1,044 | 1,101 | 1,141 | 1,865 | 2,624 | 3,136 |
| 2016 | 5,141 | 4,775 | 2,459 | 2,073 | 1,447 | 998 | 1,009 | 992 | 956 | 1,316 | 2,596 | 4,224 |
| 2017 | 4,508 | 3,322 | 3,656 | 1,736 | 1,560 | 1,219 | 1,161 | 1,144 | 1,146 | 1,444 | 2,348 | 5,087 |
| 2018 | 5,030 | 3,712 | 3,975 | 2,297 | 1,096 | 1,176 | 1,089 | 1,232 | 993 | 1,879 | 3,485 | 4,209 |
| 2019 | 4,594 | 4,354 | 3,625 | 1,780 | 1,276 | 1,010 | 931 | 1,155 | 1,025 | 971 | 3,308 | 4,606 |
| 2020 | 4,349 | 3,867 | 2,748 | 2,081 | 1,324 | 970 | 963 | 916 | 1,335 | 1,188 | 2,316 | 4,471 |
| 2021 | 4,355 | 4,320 | 3,055 | 2,038 | 1,269 | 949 | 872 | 999 | 955 | 1,292 | 3,233 | 3,218 |
| 2022 | 5,071 | 4,119 | 3,330 | 2,052 | 1,251 | 895 | 1,069 | 1,018 | 1,000 | 1,209 | 2,604 | 4,047 |
| 2023 | 3,748 | 3,110 | 3,098 | 1,531 | 1,324 | 1,158 | 959 | 930 | 951 | 1,488 | 3,155 | 3,514 |
| 2024 | 4,400 | |||||||||||
| - = No Data Reported; -- = Not Applicable; NA = Not Available; W = Withheld to avoid disclosure of individual company data. |
| Release Date: 3/29/2024 |
| Next Release Date: 4/30/2024 |