|
Download Data (XLS File) |
|
||||||||
|
||||||||
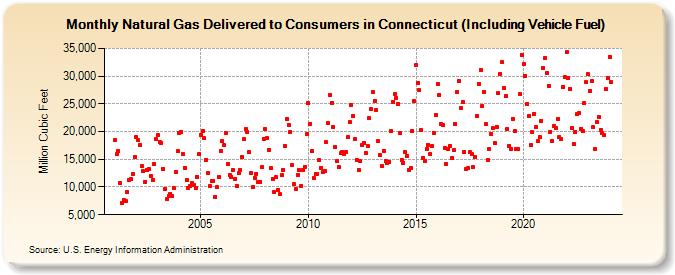
| Natural Gas Delivered to Consumers in Connecticut (Including Vehicle Fuel) (Million Cubic Feet) | ||||||||
| Year | Jan | Feb | Mar | Apr | May | Jun | Jul | Aug | Sep | Oct | Nov | Dec |
|---|---|---|---|---|---|---|---|---|---|---|---|---|
| 2001 | 18,442 | 15,861 | 16,485 | 10,646 | 7,197 | 7,730 | 7,420 | 9,010 | 11,276 | 11,370 | 12,345 | 15,400 |
| 2002 | 19,009 | 18,410 | 17,585 | 13,782 | 12,805 | 10,983 | 13,033 | 13,177 | 12,069 | 11,230 | 14,214 | 18,625 |
| 2003 | 19,308 | 18,126 | 17,872 | 13,329 | 9,619 | 7,757 | 8,318 | 8,775 | 8,389 | 9,797 | 12,778 | 16,442 |
| 2004 | 19,725 | 19,986 | 15,986 | 13,516 | 11,263 | 9,889 | 10,184 | 10,663 | 10,334 | 9,761 | 11,869 | 15,876 |
| 2005 | 19,417 | 20,079 | 18,777 | 14,958 | 12,586 | 10,204 | 11,073 | 11,107 | 8,196 | 9,915 | 11,821 | 16,510 |
| 2006 | 18,231 | 17,525 | 19,733 | 14,202 | 12,151 | 11,858 | 13,076 | 11,527 | 10,196 | 12,435 | 13,047 | 15,442 |
| 2007 | 18,625 | 20,448 | 19,841 | 16,226 | 12,558 | 9,968 | 11,663 | 12,416 | 10,842 | 10,922 | 13,602 | 18,620 |
| 2008 | 20,542 | 18,768 | 16,706 | 13,409 | 11,416 | 9,069 | 11,732 | 9,545 | 8,662 | 12,106 | 13,148 | 17,393 |
| 2009 | 22,338 | 21,250 | 19,891 | 13,878 | 10,476 | 9,665 | 12,191 | 13,011 | 10,189 | 13,094 | 13,680 | 19,513 |
| 2010 | 25,104 | 21,381 | 16,467 | 11,655 | 12,416 | 12,385 | 14,836 | 13,482 | 12,628 | 12,839 | 18,032 | 21,462 |
| 2011 | 26,604 | 25,210 | 20,866 | 17,239 | 14,717 | 13,614 | 16,080 | 16,387 | 16,019 | 16,324 | 18,930 | 21,743 |
| 2012 | 24,799 | 22,749 | 18,671 | 14,924 | 13,051 | 14,653 | 17,613 | 17,892 | 16,176 | 17,374 | 22,389 | 24,118 |
| 2013 | 27,058 | 25,586 | 23,930 | 18,248 | 15,716 | 13,827 | 16,537 | 14,765 | 14,397 | 14,597 | 20,024 | 25,410 |
| 2014 | 26,722 | 26,137 | 25,057 | 19,705 | 14,891 | 14,406 | 16,387 | 15,637 | 13,102 | 13,510 | 20,103 | 25,507 |
| 2015 | 32,005 | 28,813 | 27,426 | 20,226 | 15,300 | 14,703 | 16,781 | 17,632 | 15,909 | 17,381 | 19,714 | 23,073 |
| 2016 | 28,655 | 26,671 | 21,405 | 21,107 | 17,080 | 14,221 | 16,793 | 17,471 | 15,162 | 16,616 | 21,341 | 27,095 |
| 2017 | 29,153 | 24,214 | 25,362 | 16,375 | 13,238 | 13,382 | 16,267 | 15,964 | 13,570 | 15,457 | 22,784 | 28,638 |
| 2018 | 31,112 | 24,603 | 27,169 | 21,289 | 14,834 | 16,875 | 19,549 | 20,588 | 17,952 | 20,900 | 26,888 | 30,380 |
| 2019 | 32,475 | 27,827 | 26,372 | 20,460 | 17,413 | 16,814 | 22,325 | 20,133 | 16,850 | 16,775 | 26,720 | 33,879 |
| 2020 | 32,100 | 30,097 | 24,971 | 22,845 | 17,522 | 19,868 | 23,224 | 20,824 | 18,216 | 18,980 | 21,909 | 31,421 |
| 2021 | 33,290 | 30,523 | 28,221 | 19,982 | 18,308 | 20,933 | 20,580 | 22,339 | 19,053 | 18,597 | 28,025 | 29,797 |
| 2022 | 34,318 | 29,702 | 27,755 | 20,701 | 17,843 | 19,998 | 23,095 | 23,278 | 20,547 | 20,068 | 25,109 | 28,928 |
| 2023 | 30,365 | 27,377 | 29,120 | 20,751 | 16,816 | 21,762 | 22,633 | 20,302 | 19,651 | 19,396 | 27,709 | 29,663 |
| 2024 | 33,492 | |||||||||||
| - = No Data Reported; -- = Not Applicable; NA = Not Available; W = Withheld to avoid disclosure of individual company data. |
| Release Date: 3/29/2024 |
| Next Release Date: 4/30/2024 |