|
Download Data (XLS File) |
|
||||||||
|
||||||||
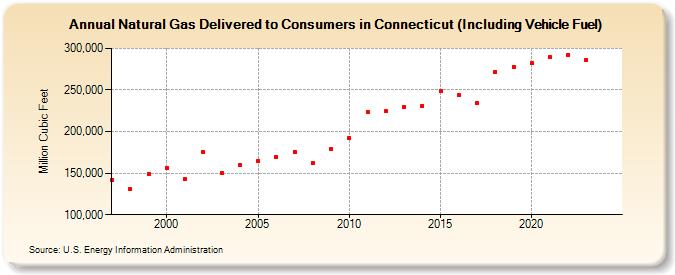
| Natural Gas Delivered to Consumers in Connecticut (Including Vehicle Fuel) (Million Cubic Feet) | ||||||||
| Decade | Year-0 | Year-1 | Year-2 | Year-3 | Year-4 | Year-5 | Year-6 | Year-7 | Year-8 | Year-9 |
|---|---|---|---|---|---|---|---|---|---|---|
| 1990's | 142,216 | 130,664 | 149,294 | |||||||
| 2000's | 156,692 | 143,330 | 175,072 | 150,692 | 159,259 | 164,740 | 169,504 | 175,820 | 162,576 | 179,225 |
| 2010's | 192,687 | 223,734 | 224,409 | 230,094 | 231,163 | 248,963 | 243,618 | 234,404 | 272,139 | 278,042 |
| 2020's | 281,975 | 289,649 | 291,344 | 285,545 |
| - = No Data Reported; -- = Not Applicable; NA = Not Available; W = Withheld to avoid disclosure of individual company data. |
| Release Date: 3/29/2024 |
| Next Release Date: 4/30/2024 |