|
Download Data (XLS File) |
|
||||||||
|
||||||||
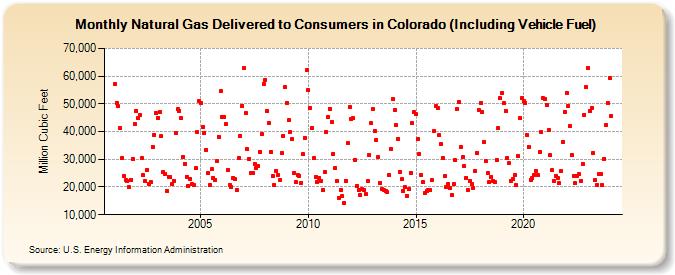
| Natural Gas Delivered to Consumers in Colorado (Including Vehicle Fuel) (Million Cubic Feet) | ||||||||
| Year | Jan | Feb | Mar | Apr | May | Jun | Jul | Aug | Sep | Oct | Nov | Dec |
|---|---|---|---|---|---|---|---|---|---|---|---|---|
| 2001 | 57,089 | 50,447 | 49,042 | 41,157 | 30,506 | 23,904 | 22,403 | 22,033 | 19,905 | 22,672 | 30,231 | 42,797 |
| 2002 | 47,541 | 44,713 | 45,909 | 30,319 | 24,230 | 22,105 | 26,301 | 21,119 | 21,764 | 34,563 | 38,884 | 46,826 |
| 2003 | 44,971 | 47,164 | 38,292 | 25,380 | 24,811 | 18,484 | 23,772 | 23,529 | 20,981 | 22,248 | 39,408 | 48,023 |
| 2004 | 47,548 | 44,859 | 30,853 | 28,458 | 23,766 | 20,408 | 22,895 | 21,210 | 20,651 | 26,731 | 39,719 | 50,977 |
| 2005 | 50,356 | 41,495 | 39,617 | 33,501 | 25,108 | 20,725 | 26,350 | 23,387 | 22,698 | 29,399 | 38,140 | 54,566 |
| 2006 | 45,074 | 45,360 | 42,614 | 26,074 | 20,799 | 20,115 | 23,277 | 22,817 | 18,928 | 30,373 | 38,546 | 49,332 |
| 2007 | 62,803 | 46,554 | 33,579 | 30,243 | 25,136 | 25,014 | 28,465 | 26,787 | 27,444 | 32,786 | 39,145 | 57,263 |
| 2008 | 58,610 | 47,388 | 43,199 | 32,792 | 23,933 | 20,557 | 25,703 | 24,440 | 22,557 | 32,281 | 38,528 | 55,923 |
| 2009 | 50,474 | 44,029 | 39,678 | 37,397 | 25,093 | 21,750 | 24,476 | 24,078 | 21,589 | 31,800 | 37,832 | 62,055 |
| 2010 | 54,904 | 48,559 | 41,288 | 30,445 | 23,776 | 21,818 | 23,405 | 22,245 | 18,834 | 25,519 | 39,921 | 45,369 |
| 2011 | 48,254 | 43,398 | 32,037 | 26,879 | 22,076 | 16,209 | 18,896 | 16,778 | 14,192 | 22,305 | 35,724 | 48,915 |
| 2012 | 44,362 | 44,713 | 29,902 | 20,386 | 18,864 | 16,987 | 19,166 | 18,834 | 17,392 | 22,081 | 31,502 | 42,920 |
| 2013 | 47,976 | 40,285 | 37,003 | 30,665 | 21,590 | 19,120 | 19,021 | 18,403 | 18,093 | 24,355 | 33,584 | 51,684 |
| 2014 | 47,838 | 42,235 | 37,491 | 25,416 | 22,827 | 18,625 | 19,927 | 16,776 | 19,163 | 25,138 | 43,020 | 46,897 |
| 2015 | 46,190 | 37,360 | 31,835 | 24,301 | 21,759 | 17,982 | 18,580 | 18,748 | 18,738 | 22,353 | 40,204 | 49,125 |
| 2016 | 48,543 | 38,671 | 35,560 | 30,476 | 23,832 | 20,175 | 21,082 | 19,706 | 17,151 | 21,022 | 29,725 | 48,093 |
| 2017 | 50,825 | 34,545 | 30,707 | 27,439 | 23,305 | 18,915 | 22,110 | 20,989 | 19,688 | 25,788 | 32,409 | 47,906 |
| 2018 | 50,367 | 46,962 | 36,404 | 29,250 | 24,869 | 21,697 | 23,619 | 22,095 | 21,672 | 29,781 | 41,173 | 51,971 |
| 2019 | 53,863 | 50,198 | 47,572 | 30,614 | 28,500 | 22,334 | 22,723 | 24,237 | 20,663 | 31,335 | 44,735 | 51,979 |
| 2020 | 50,851 | 50,375 | 38,817 | 34,595 | 22,617 | 23,253 | 24,357 | 25,673 | 24,255 | 32,681 | 39,691 | 51,999 |
| 2021 | 51,840 | 49,636 | 40,430 | 31,445 | 25,953 | 22,246 | 23,918 | 23,308 | 21,318 | 25,816 | 36,185 | 47,161 |
| 2022 | 53,915 | 49,283 | 41,944 | 31,513 | 24,019 | 21,343 | 24,080 | 24,587 | 22,286 | 28,307 | 46,096 | 56,056 |
| 2023 | 62,948 | 47,406 | 48,604 | 32,302 | 22,696 | 20,793 | 24,679 | 24,827 | 20,691 | 30,259 | 42,337 | 50,372 |
| 2024 | 59,240 | |||||||||||
| - = No Data Reported; -- = Not Applicable; NA = Not Available; W = Withheld to avoid disclosure of individual company data. |
| Release Date: 3/29/2024 |
| Next Release Date: 4/30/2024 |