|
Download Data (XLS File) |
|
||||||||
|
||||||||
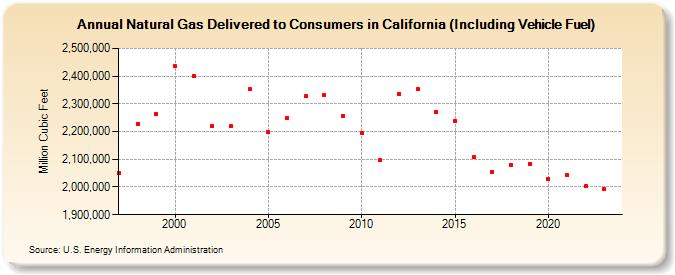
| Natural Gas Delivered to Consumers in California (Including Vehicle Fuel) (Million Cubic Feet) | ||||||||
| Decade | Year-0 | Year-1 | Year-2 | Year-3 | Year-4 | Year-5 | Year-6 | Year-7 | Year-8 | Year-9 |
|---|---|---|---|---|---|---|---|---|---|---|
| 1990's | 2,049,536 | 2,228,414 | 2,264,158 | |||||||
| 2000's | 2,434,770 | 2,400,993 | 2,218,923 | 2,218,715 | 2,353,823 | 2,196,741 | 2,248,988 | 2,327,205 | 2,330,514 | 2,256,380 |
| 2010's | 2,196,086 | 2,096,279 | 2,337,017 | 2,352,421 | 2,270,834 | 2,238,223 | 2,108,402 | 2,055,076 | 2,078,116 | 2,083,609 |
| 2020's | 2,027,954 | 2,042,481 | 2,001,832 | 1,991,855 |
| - = No Data Reported; -- = Not Applicable; NA = Not Available; W = Withheld to avoid disclosure of individual company data. |
| Release Date: 8/30/2024 |
| Next Release Date: 9/30/2024 |