|
Download Data (XLS File) |
|
||||||||
|
||||||||
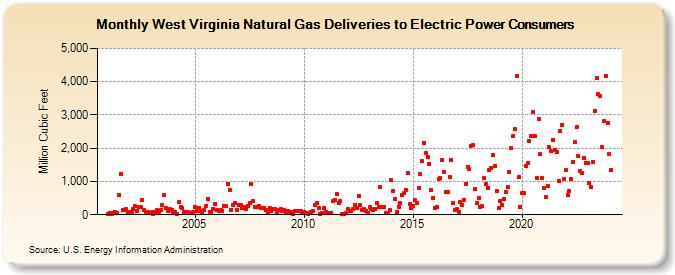
| West Virginia Natural Gas Deliveries to Electric Power Consumers (Million Cubic Feet) | ||||||||
| Year | Jan | Feb | Mar | Apr | May | Jun | Jul | Aug | Sep | Oct | Nov | Dec |
|---|---|---|---|---|---|---|---|---|---|---|---|---|
| 2001 | 19 | 66 | 16 | 50 | 95 | 47 | 598 | 1,238 | 138 | 148 | 165 | 41 |
| 2002 | 76 | 58 | 164 | 253 | 99 | 229 | 219 | 448 | 139 | 81 | 73 | 45 |
| 2003 | 67 | 36 | 76 | 140 | 95 | 144 | 284 | 602 | 206 | 116 | 169 | 151 |
| 2004 | 54 | 76 | 25 | 382 | 235 | 197 | 82 | 86 | 69 | 65 | 42 | 93 |
| 2005 | 227 | 99 | 202 | 114 | 89 | 153 | 268 | 459 | 73 | 91 | 184 | 327 |
| 2006 | 135 | 124 | 141 | 122 | 263 | 252 | 920 | 757 | 156 | 301 | 348 | 144 |
| 2007 | 279 | 279 | 191 | 233 | 184 | 257 | 351 | 926 | 417 | 240 | 222 | 271 |
| 2008 | 215 | 215 | 193 | 156 | 89 | 213 | 101 | 175 | 162 | 62 | 141 | 167 |
| 2009 | 108 | 144 | 81 | 97 | 76 | 71 | 34 | 99 | 98 | 100 | 113 | 86 |
| 2010 | 83 | 53 | 23 | 53 | 72 | 97 | 287 | 360 | 187 | 17 | 48 | 202 |
| 2011 | 96 | 39 | 46 | 46 | 422 | 436 | 621 | 356 | 423 | 11 | 27 | 55 |
| 2012 | 167 | 113 | 113 | 165 | 287 | 194 | 550 | 289 | 150 | 170 | 122 | 42 |
| 2013 | 227 | 165 | 155 | 179 | 352 | 224 | 846 | 240 | 222 | 43 | 50 | 136 |
| 2014 | 1,050 | 723 | 479 | 74 | 246 | 347 | 598 | 660 | 732 | 1,268 | 319 | 215 |
| 2015 | 256 | 430 | 358 | 803 | 1,211 | 1,612 | 2,142 | 1,870 | 1,740 | 1,536 | 754 | 509 |
| 2016 | 204 | 222 | 1,077 | 1,098 | 1,658 | 1,298 | 672 | 680 | 1,134 | 1,632 | 361 | 131 |
| 2017 | 174 | 71 | 374 | 299 | 454 | 937 | 1,437 | 1,375 | 2,069 | 2,100 | 783 | 352 |
| 2018 | 504 | 242 | 251 | 1,091 | 922 | 791 | 1,347 | 1,396 | 1,790 | 1,464 | 727 | 201 |
| 2019 | 418 | 286 | 463 | 694 | 822 | 1,288 | 2,013 | 2,372 | 2,567 | 4,177 | 1,129 | 223 |
| 2020 | 656 | 661 | 1,473 | 1,542 | 2,206 | 2,357 | 3,085 | 2,380 | 1,105 | 2,883 | 1,825 | 1,103 |
| 2021 | 805 | 518 | 867 | 2,026 | 1,914 | 2,257 | 1,954 | 1,891 | 1,028 | 2,505 | 2,703 | 1,076 |
| 2022 | 1,343 | 590 | 704 | 1,064 | 1,586 | 2,173 | 2,635 | 1,755 | 1,308 | 1,240 | 1,712 | 1,567 |
| 2023 | 1,542 | 942 | 830 | 1,583 | 3,113 | 4,117 | 3,617 | 3,561 | 2,032 | 2,818 | 4,169 | 2,750 |
| 2024 | 1,830 | |||||||||||
| - = No Data Reported; -- = Not Applicable; NA = Not Available; W = Withheld to avoid disclosure of individual company data. |
| Release Date: 3/29/2024 |
| Next Release Date: 4/30/2024 |