|
Download Data (XLS File) |
|
||||||||
|
||||||||
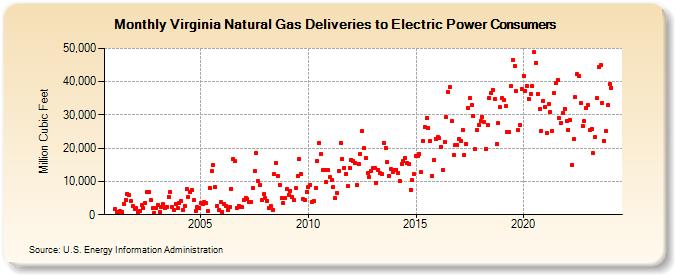
| Virginia Natural Gas Deliveries to Electric Power Consumers (Million Cubic Feet) | ||||||||
| Year | Jan | Feb | Mar | Apr | May | Jun | Jul | Aug | Sep | Oct | Nov | Dec |
|---|---|---|---|---|---|---|---|---|---|---|---|---|
| 2001 | 1,606 | 700 | 643 | 1,113 | 924 | 3,118 | 4,493 | 6,360 | 5,831 | 4,012 | 2,546 | 1,773 |
| 2002 | 2,080 | 942 | 1,105 | 2,957 | 1,949 | 3,473 | 6,757 | 6,819 | 4,318 | 1,913 | 659 | 1,963 |
| 2003 | 3,058 | 814 | 2,442 | 3,186 | 2,132 | 2,323 | 5,401 | 6,875 | 2,191 | 1,488 | 3,330 | 2,014 |
| 2004 | 3,391 | 4,221 | 1,468 | 2,754 | 7,758 | 5,257 | 6,805 | 7,343 | 4,415 | 1,065 | 2,302 | 2,006 |
| 2005 | 3,494 | 3,169 | 3,825 | 3,400 | 1,004 | 8,105 | 13,031 | 14,892 | 8,184 | 2,727 | 1,337 | 3,782 |
| 2006 | 753 | 3,326 | 2,765 | 1,439 | 2,191 | 7,879 | 16,761 | 16,098 | 2,052 | 2,631 | 2,252 | 2,174 |
| 2007 | 4,366 | 5,051 | 4,750 | 3,748 | 3,837 | 7,933 | 13,105 | 18,521 | 10,000 | 8,866 | 4,298 | 6,098 |
| 2008 | 4,936 | 4,271 | 2,044 | 2,496 | 1,327 | 12,140 | 15,637 | 11,552 | 9,011 | 4,990 | 3,573 | 5,006 |
| 2009 | 7,751 | 5,980 | 7,226 | 5,284 | 4,461 | 7,930 | 11,549 | 16,675 | 12,104 | 4,686 | 4,314 | 6,868 |
| 2010 | 8,462 | 9,062 | 3,866 | 4,051 | 8,162 | 16,095 | 21,682 | 18,204 | 13,407 | 13,553 | 9,771 | 13,441 |
| 2011 | 11,260 | 10,373 | 8,224 | 4,978 | 6,627 | 13,279 | 21,602 | 16,768 | 14,156 | 12,366 | 8,638 | 14,012 |
| 2012 | 16,477 | 16,083 | 15,591 | 8,832 | 15,240 | 18,398 | 25,195 | 19,932 | 17,131 | 12,418 | 11,311 | 13,239 |
| 2013 | 13,905 | 13,928 | 9,626 | 13,473 | 12,606 | 12,379 | 21,586 | 20,036 | 15,819 | 11,783 | 13,604 | 12,843 |
| 2014 | 13,443 | 13,592 | 12,646 | 10,055 | 15,387 | 16,051 | 17,106 | 15,657 | 15,157 | 7,568 | 10,341 | 12,151 |
| 2015 | 17,704 | 17,648 | 18,274 | 12,706 | 22,131 | 26,227 | 29,067 | 26,159 | 22,112 | 11,729 | 16,554 | 22,865 |
| 2016 | 23,283 | 22,925 | 20,405 | 13,517 | 21,823 | 29,260 | 36,894 | 38,312 | 28,121 | 18,088 | 20,924 | 20,971 |
| 2017 | 22,614 | 22,207 | 25,447 | 17,945 | 21,357 | 32,025 | 35,127 | 32,949 | 29,699 | 19,668 | 25,477 | 26,930 |
| 2018 | 28,221 | 29,317 | 27,803 | 19,806 | 26,834 | 35,073 | 36,519 | 37,580 | 34,815 | 21,233 | 27,502 | 32,319 |
| 2019 | 35,076 | 34,456 | 32,635 | 24,775 | 24,904 | 38,686 | 46,652 | 44,765 | 37,120 | 25,519 | 27,116 | 37,721 |
| 2020 | 41,833 | 37,319 | 38,685 | 34,813 | 36,252 | 38,604 | 48,813 | 45,647 | 36,344 | 31,850 | 25,244 | 34,217 |
| 2021 | 32,329 | 24,677 | 33,225 | 30,908 | 25,235 | 36,445 | 39,495 | 40,631 | 28,939 | 27,591 | 30,617 | 31,810 |
| 2022 | 28,217 | 25,611 | 28,599 | 15,048 | 22,825 | 35,244 | 42,272 | 41,740 | 33,450 | 26,673 | 28,088 | 32,207 |
| 2023 | 32,992 | 25,401 | 25,735 | 18,409 | 23,272 | 34,986 | 44,400 | 44,961 | 33,580 | 22,248 | 25,236 | 32,973 |
| 2024 | 39,215 | |||||||||||
| - = No Data Reported; -- = Not Applicable; NA = Not Available; W = Withheld to avoid disclosure of individual company data. |
| Release Date: 3/29/2024 |
| Next Release Date: 4/30/2024 |