|
Download Data (XLS File) |
|
||||||||
|
||||||||
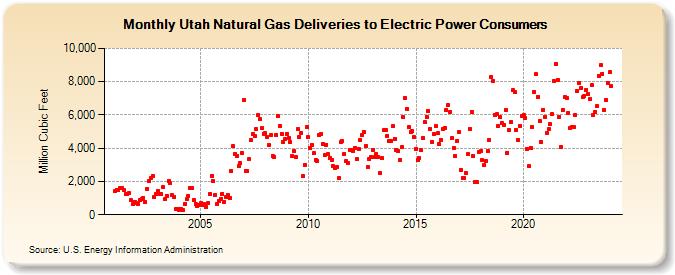
| Utah Natural Gas Deliveries to Electric Power Consumers (Million Cubic Feet) | ||||||||
| Year | Jan | Feb | Mar | Apr | May | Jun | Jul | Aug | Sep | Oct | Nov | Dec |
|---|---|---|---|---|---|---|---|---|---|---|---|---|
| 2001 | 1,408 | 1,508 | 1,470 | 1,594 | 1,601 | 1,475 | 1,250 | 1,271 | 1,280 | 863 | 636 | 785 |
| 2002 | 703 | 667 | 899 | 958 | 1,024 | 758 | 1,570 | 2,022 | 2,199 | 2,334 | 1,065 | 1,239 |
| 2003 | 1,432 | 1,248 | 1,235 | 1,652 | 927 | 1,145 | 2,002 | 1,884 | 1,181 | 1,076 | 332 | 372 |
| 2004 | 313 | 333 | 254 | 639 | 924 | 1,131 | 1,597 | 1,604 | 890 | 638 | 515 | 584 |
| 2005 | 686 | 571 | 620 | 467 | 682 | 1,236 | 2,347 | 2,010 | 1,214 | 622 | 813 | 972 |
| 2006 | 1,266 | 778 | 1,064 | 1,175 | 1,034 | 2,619 | 4,103 | 3,659 | 3,536 | 2,900 | 3,094 | 3,726 |
| 2007 | 6,904 | 2,638 | 2,608 | 3,349 | 4,472 | 4,841 | 4,728 | 5,131 | 5,973 | 5,737 | 5,184 | 4,873 |
| 2008 | 4,896 | 4,678 | 4,168 | 4,793 | 3,524 | 3,455 | 4,789 | 5,961 | 5,334 | 4,868 | 4,347 | 4,561 |
| 2009 | 4,882 | 4,617 | 4,361 | 3,529 | 3,830 | 3,448 | 5,153 | 4,672 | 4,911 | 2,319 | 3,008 | 5,254 |
| 2010 | 4,655 | 4,015 | 4,195 | 3,681 | 3,292 | 3,242 | 4,775 | 4,853 | 4,255 | 3,582 | 4,220 | 3,635 |
| 2011 | 3,394 | 3,294 | 2,904 | 2,798 | 2,879 | 2,191 | 4,347 | 4,416 | 3,668 | 3,208 | 3,125 | 3,914 |
| 2012 | 3,905 | 3,859 | 4,028 | 3,331 | 3,954 | 4,498 | 4,778 | 4,999 | 4,134 | 2,858 | 3,353 | 3,442 |
| 2013 | 3,894 | 3,485 | 3,653 | 3,490 | 2,514 | 3,404 | 5,075 | 5,106 | 4,738 | 4,444 | 4,433 | 5,328 |
| 2014 | 4,552 | 3,888 | 3,829 | 3,310 | 4,050 | 5,848 | 7,018 | 6,378 | 5,262 | 4,970 | 5,012 | 4,665 |
| 2015 | 3,937 | 3,267 | 3,409 | 3,864 | 4,621 | 5,560 | 5,845 | 6,232 | 5,164 | 4,371 | 4,875 | 5,305 |
| 2016 | 4,892 | 4,249 | 4,493 | 5,155 | 5,222 | 6,303 | 6,592 | 6,195 | 4,590 | 4,025 | 3,529 | 4,438 |
| 2017 | 4,982 | 2,710 | 2,215 | 2,208 | 2,494 | 3,635 | 5,182 | 6,182 | 3,531 | 1,950 | 1,967 | 3,773 |
| 2018 | 3,801 | 3,266 | 3,015 | 3,253 | 3,814 | 4,478 | 8,251 | 8,060 | 6,013 | 6,035 | 5,317 | 5,858 |
| 2019 | 5,501 | 5,417 | 6,302 | 3,729 | 5,107 | 5,595 | 7,480 | 7,357 | 5,120 | 4,503 | 5,336 | 5,939 |
| 2020 | 5,996 | 5,792 | 3,974 | 2,910 | 4,011 | 5,260 | 7,399 | 8,442 | 7,107 | 5,661 | 4,374 | 6,300 |
| 2021 | 5,890 | 4,930 | 5,124 | 5,426 | 6,036 | 8,041 | 9,078 | 8,115 | 5,893 | 4,053 | 6,322 | 7,048 |
| 2022 | 7,045 | 6,125 | 5,233 | 5,287 | 5,264 | 5,977 | 7,464 | 7,917 | 7,619 | 7,059 | 7,157 | 7,519 |
| 2023 | 7,260 | 6,956 | 7,770 | 6,024 | 6,199 | 6,513 | 8,350 | 8,981 | 8,484 | 6,303 | 6,900 | 7,922 |
| 2024 | 8,558 | |||||||||||
| - = No Data Reported; -- = Not Applicable; NA = Not Available; W = Withheld to avoid disclosure of individual company data. |
| Release Date: 3/29/2024 |
| Next Release Date: 4/30/2024 |