|
Download Data (XLS File) |
|
||||||||
|
||||||||
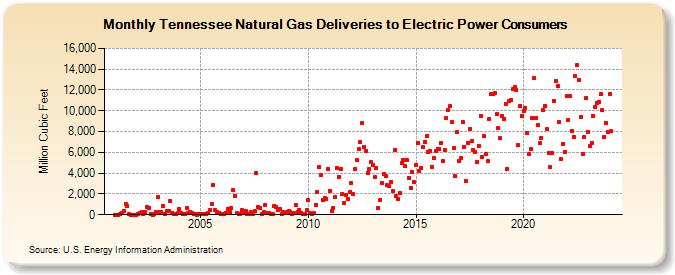
| Tennessee Natural Gas Deliveries to Electric Power Consumers (Million Cubic Feet) | ||||||||
| Year | Jan | Feb | Mar | Apr | May | Jun | Jul | Aug | Sep | Oct | Nov | Dec |
|---|---|---|---|---|---|---|---|---|---|---|---|---|
| 2001 | 0 | 0 | 2 | 68 | 169 | 313 | 1,011 | 868 | 48 | 0 | 0 | 0 |
| 2002 | 0 | 34 | 172 | 233 | 58 | 277 | 739 | 651 | 74 | 1 | 77 | 281 |
| 2003 | 1,704 | 256 | 239 | 866 | 29 | 350 | 357 | 1,324 | 177 | 75 | 104 | 140 |
| 2004 | 564 | 139 | 40 | 77 | 618 | 160 | 239 | 206 | 52 | 47 | 12 | 107 |
| 2005 | 80 | 68 | 82 | 23 | 117 | 432 | 1,014 | 2,879 | 446 | 248 | 170 | 68 |
| 2006 | 42 | 111 | 167 | 563 | 216 | 629 | 2,341 | 1,839 | 164 | 99 | 104 | 416 |
| 2007 | 292 | 362 | 68 | 99 | 249 | 114 | 398 | 4,034 | 776 | 606 | 44 | 248 |
| 2008 | 936 | 123 | 128 | 28 | 68 | 874 | 774 | 423 | 568 | 57 | 223 | 209 |
| 2009 | 256 | 352 | 291 | 109 | 125 | 969 | 276 | 479 | 182 | 65 | 76 | 490 |
| 2010 | 1,385 | 154 | 53 | 119 | 948 | 2,209 | 4,553 | 3,829 | 1,422 | 1,584 | 1,543 | 4,357 |
| 2011 | 2,306 | 341 | 679 | 1,670 | 4,503 | 3,617 | 4,420 | 2,006 | 1,174 | 1,896 | 1,524 | 2,178 |
| 2012 | 3,079 | 1,994 | 4,401 | 5,262 | 6,334 | 6,991 | 8,785 | 6,545 | 6,173 | 3,973 | 4,393 | 5,032 |
| 2013 | 4,735 | 3,598 | 4,495 | 692 | 1,426 | 3,014 | 3,935 | 3,718 | 2,855 | 2,718 | 3,171 | 2,256 |
| 2014 | 6,195 | 1,773 | 1,466 | 2,130 | 4,954 | 5,288 | 4,642 | 5,261 | 3,553 | 2,556 | 4,120 | 3,144 |
| 2015 | 4,748 | 6,909 | 4,220 | 4,480 | 6,502 | 7,019 | 7,585 | 5,993 | 6,125 | 4,568 | 5,453 | 6,151 |
| 2016 | 6,356 | 6,326 | 6,916 | 5,148 | 6,236 | 9,258 | 10,110 | 10,416 | 8,880 | 6,424 | 3,689 | 7,932 |
| 2017 | 5,164 | 5,418 | 8,921 | 6,554 | 3,232 | 6,903 | 8,247 | 7,053 | 6,271 | 6,059 | 5,112 | 6,642 |
| 2018 | 9,481 | 5,583 | 7,570 | 5,800 | 5,163 | 9,216 | 11,584 | 11,626 | 11,717 | 9,675 | 8,332 | 7,344 |
| 2019 | 9,527 | 9,235 | 10,678 | 4,379 | 10,894 | 11,019 | 12,061 | 12,292 | 11,977 | 6,692 | 10,505 | 9,467 |
| 2020 | 9,993 | 10,311 | 7,900 | 5,798 | 6,341 | 9,298 | 13,134 | 9,266 | 8,591 | 6,886 | 7,409 | 10,055 |
| 2021 | 10,442 | 8,214 | 5,984 | 4,542 | 5,976 | 10,940 | 12,903 | 12,388 | 8,929 | 5,383 | 6,826 | 6,050 |
| 2022 | 11,401 | 9,156 | 11,391 | 8,096 | 7,519 | 13,365 | 14,437 | 12,990 | 9,447 | 5,882 | 7,500 | 11,186 |
| 2023 | 7,964 | 6,605 | 6,851 | 9,523 | 10,382 | 10,750 | 10,851 | 11,606 | 10,052 | 7,478 | 8,825 | 7,955 |
| 2024 | 11,649 | |||||||||||
| - = No Data Reported; -- = Not Applicable; NA = Not Available; W = Withheld to avoid disclosure of individual company data. |
| Release Date: 3/29/2024 |
| Next Release Date: 4/30/2024 |