|
Download Data (XLS File) |
|
||||||||
|
||||||||
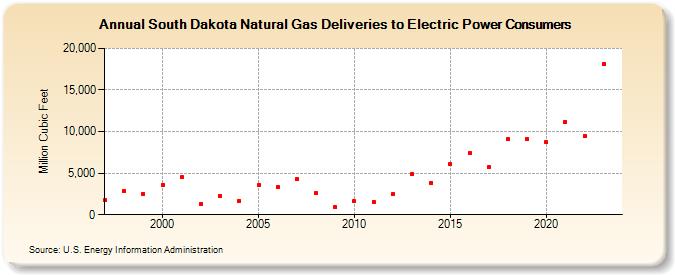
| South Dakota Natural Gas Deliveries to Electric Power Consumers (Million Cubic Feet) | ||||||||
| Decade | Year-0 | Year-1 | Year-2 | Year-3 | Year-4 | Year-5 | Year-6 | Year-7 | Year-8 | Year-9 |
|---|---|---|---|---|---|---|---|---|---|---|
| 1990's | 1,731 | 2,865 | 2,527 | |||||||
| 2000's | 3,607 | 4,496 | 1,265 | 2,264 | 1,676 | 3,567 | 3,345 | 4,235 | 2,632 | 918 |
| 2010's | 1,600 | 1,589 | 2,465 | 4,911 | 3,865 | 6,128 | 7,410 | 5,713 | 9,099 | 9,099 |
| 2020's | 8,704 | 11,180 | 9,492 | 18,130 |
| - = No Data Reported; -- = Not Applicable; NA = Not Available; W = Withheld to avoid disclosure of individual company data. |
| Release Date: 8/30/2024 |
| Next Release Date: 9/30/2024 |